

It almost seems like the closer we get to Halloween, the weirder things are getting.
While last week’s price action continued to show a defensive shift in this market, the S&P 500 nearly triggered one of the most bullish signals one could wish for. At least from our perspective.
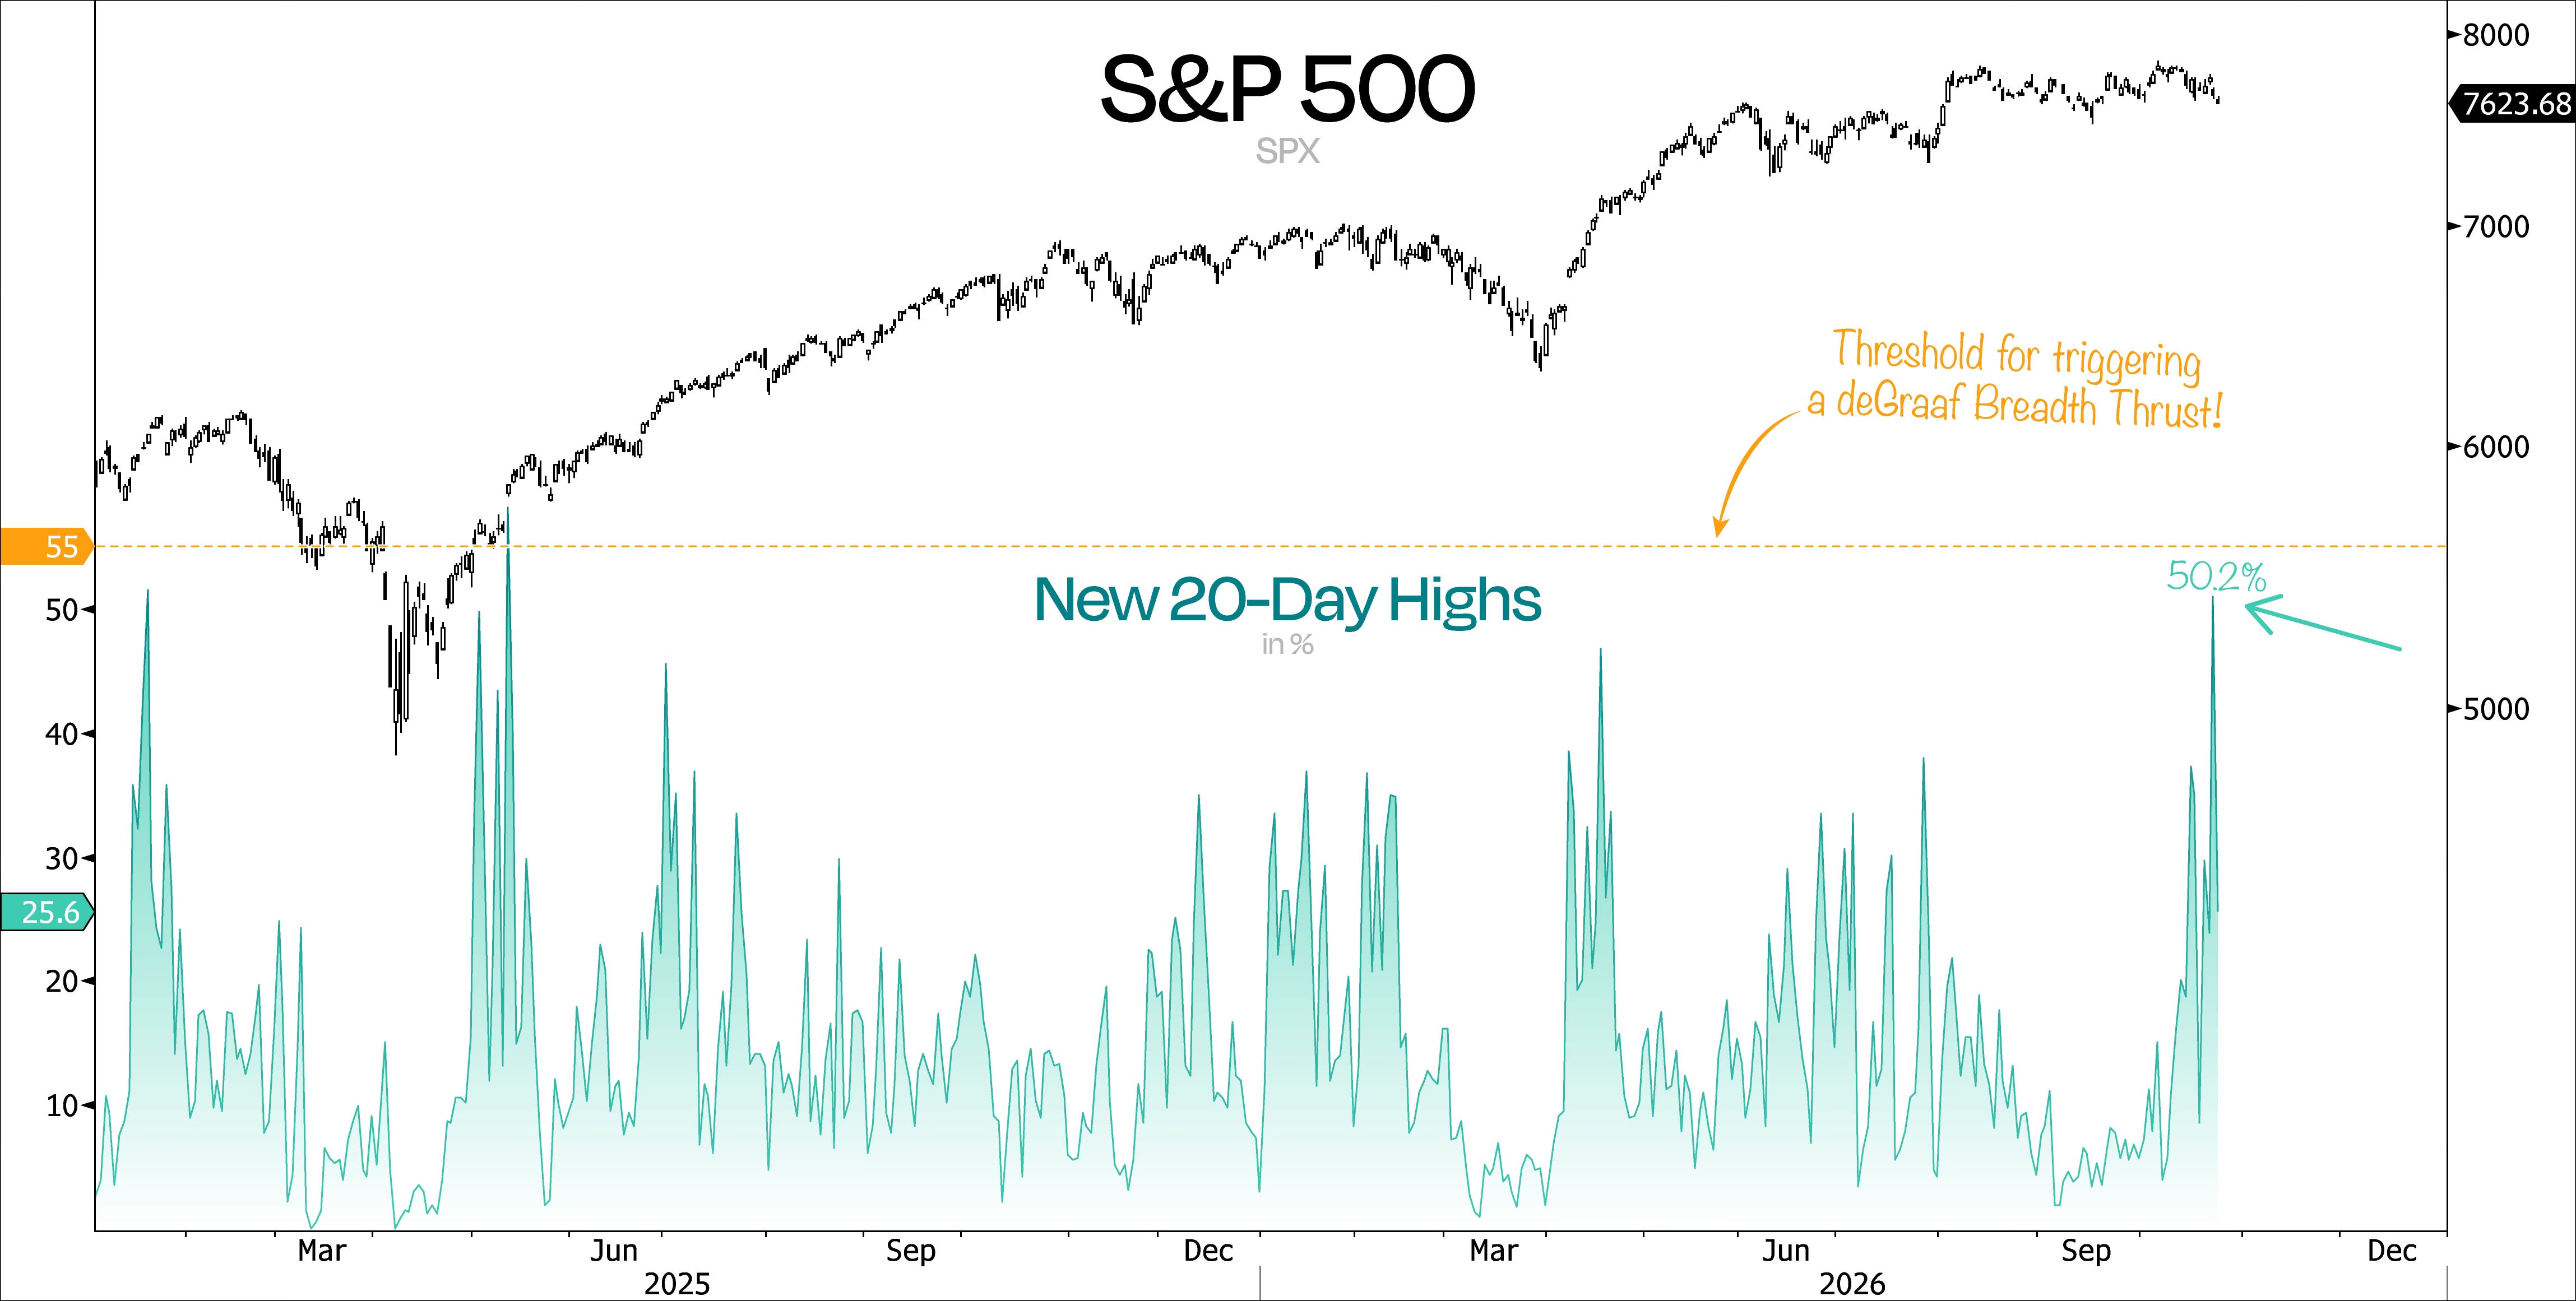
On the very same day that the Nasdaq 100 tumbled 3% and the S&P 500 lost more than 1%, we came remarkably close to triggering a fresh deGraaf Breadth Thrust — the first since May 2025. Back then, the S&P 500 triggered the same signal while ripping 3.3% higher on the day. Quite the contrast. This time around, though, the market was selling off hard while the number of stocks hitting new short-term highs was surging.
A deGraaf Breadth Thrust is triggered when at least 55% of S&P 500 stocks close at new 20-day highs. Last Thursday, we reached 50.2%.
And that’s what makes the current setup so difficult to gauge. As investors debate whether the bull market is nearing its end with the AI trade losing steam, we’re potentially just one broad-based rally away from triggering one of the most bullish signals in our playbook.
And we say that with high conviction: A deGraaf Breadth Thrust marks the start of a new bullish regime lasting one year. And over the past three decades, literally all of the S&P 500’s net gains have come during these regimes.
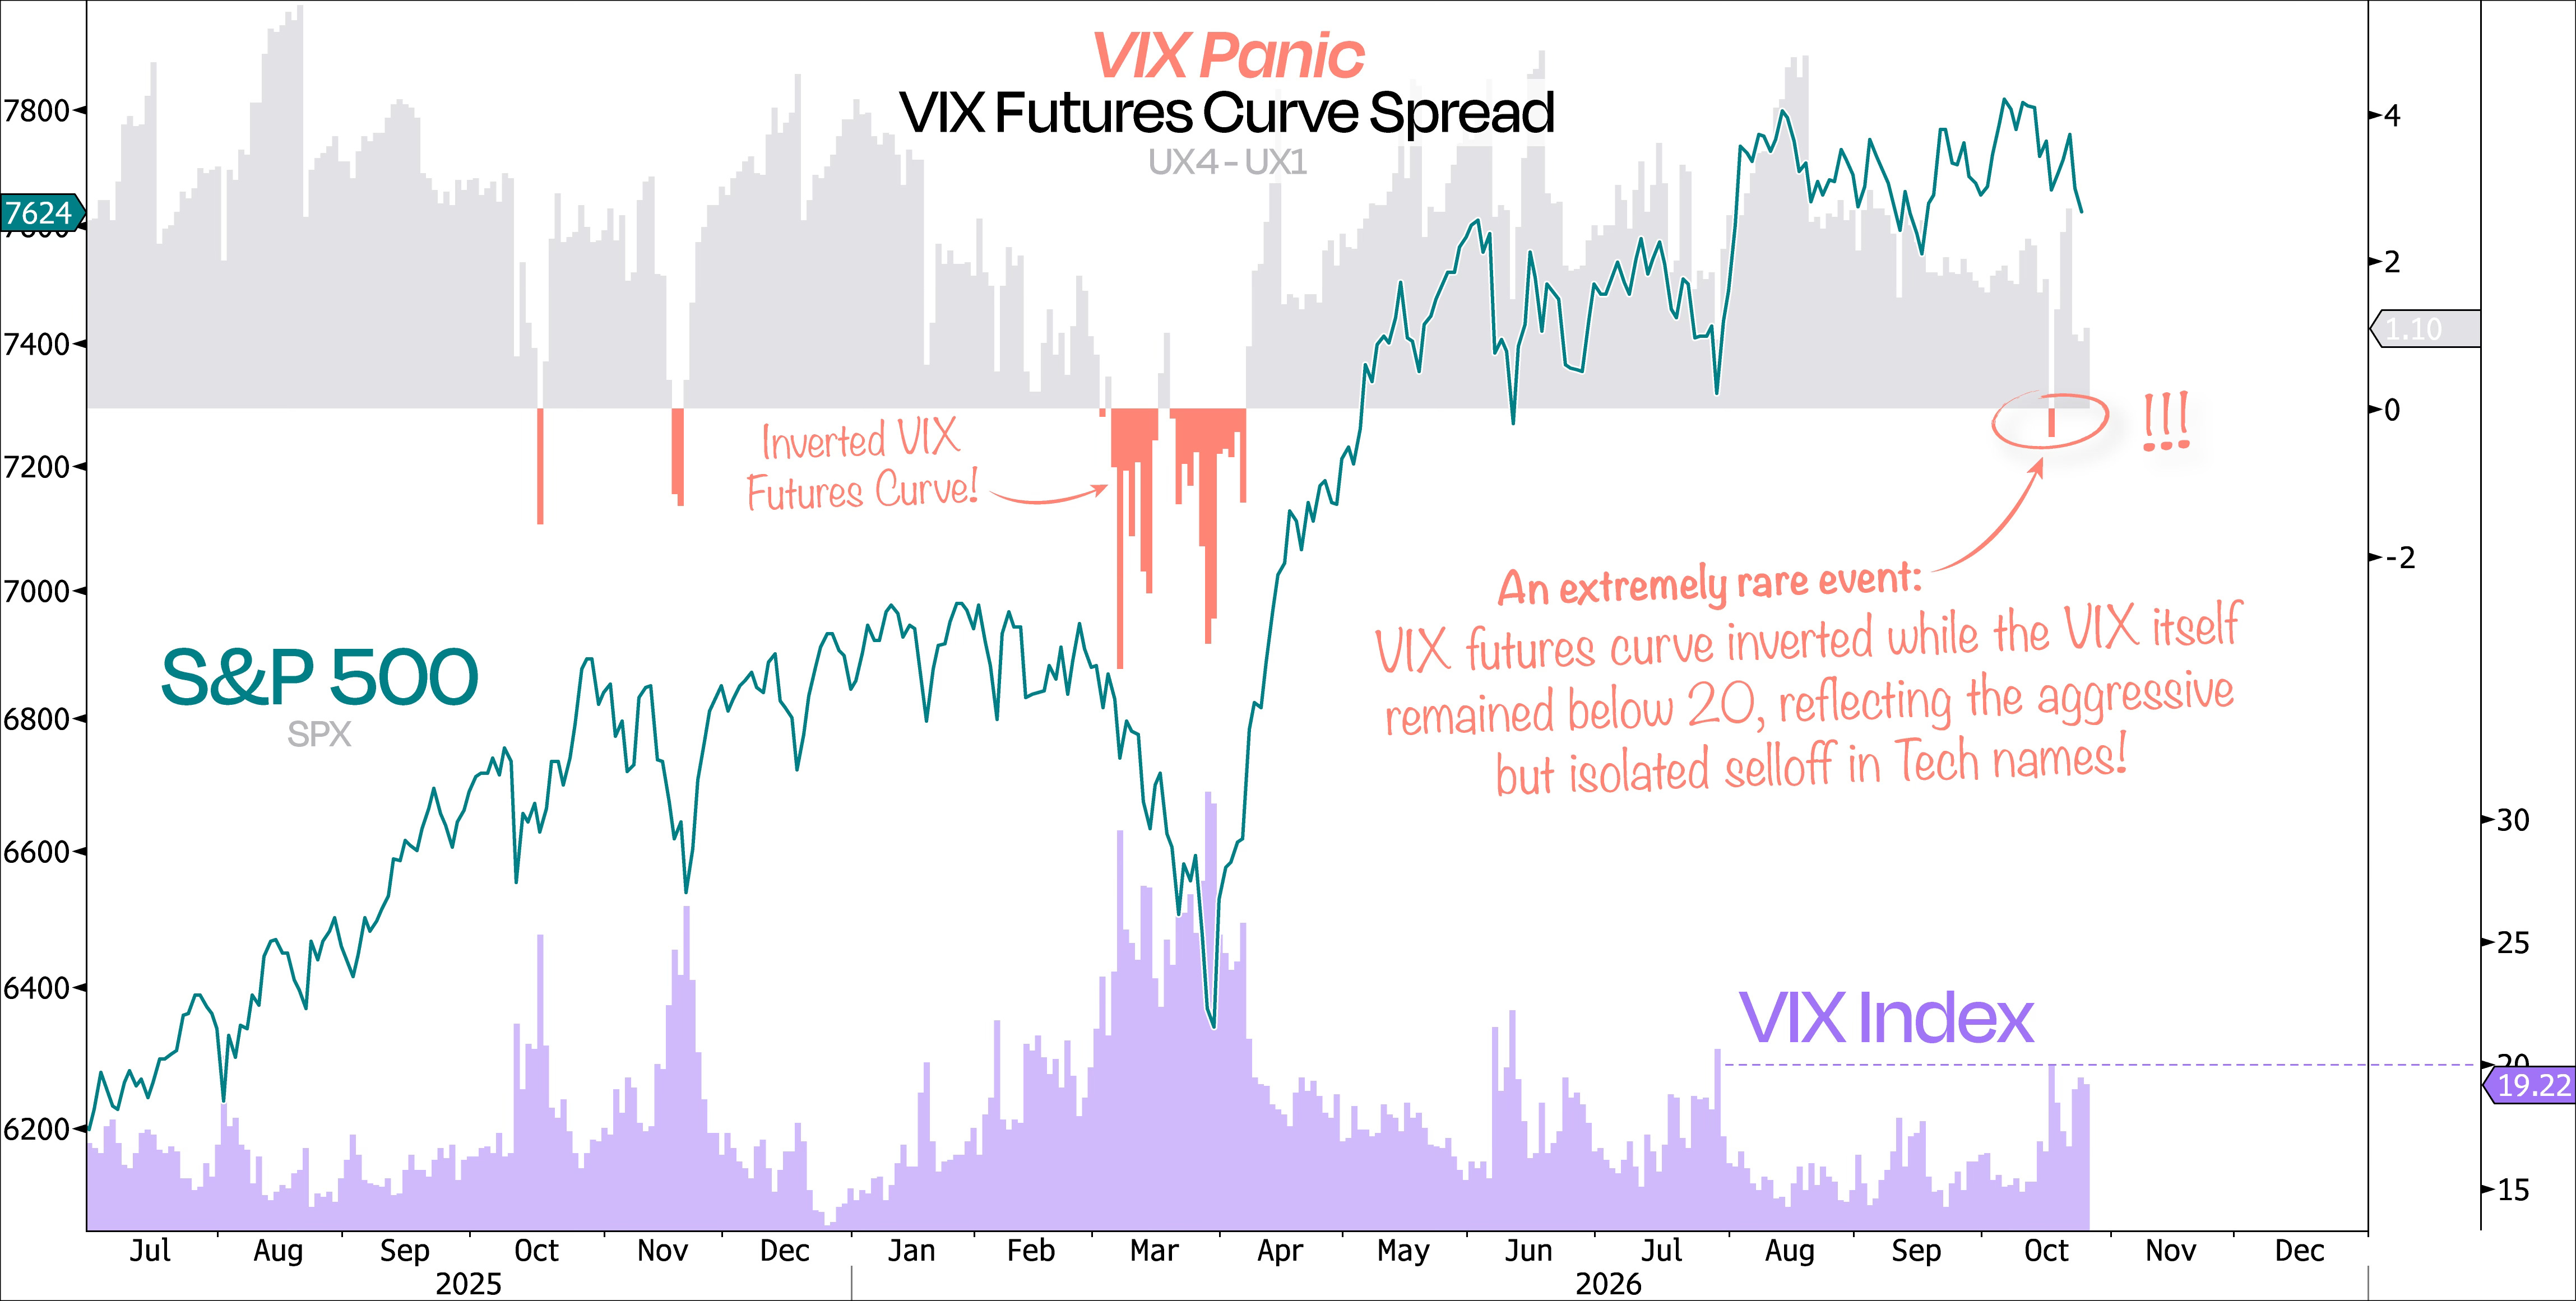
Indeed, a Tech rebound following its latest flush shouldn’t come as much of a surprise. After all, while the VIX itself has remained relatively calm, we did see something extremely unusual that rarely happens with the VIX still below 20.
A week ago on Friday, the VIX futures curve briefly inverted, meaning near-term futures traded above longer-dated contracts. This typically signals elevated near-term fear and stress, even when the spot VIX itself doesn’t look particularly alarming.
Call it panic. And last week’s price action may simply have been the aftermath of that burst of fear. And to be honest, it wouldn’t surprise us if the market was once again doing what it does best: resetting overly bullish sentiment and flushing out investors who came into October convinced that we’re entering the most bullish 9-month stretch of the 4-year presidential cycle — just to mess with everyone’s heads!
Now, the way it often does that is by swinging hard in the opposite direction. And we’ve seen this before. Just think back to the July selloff.
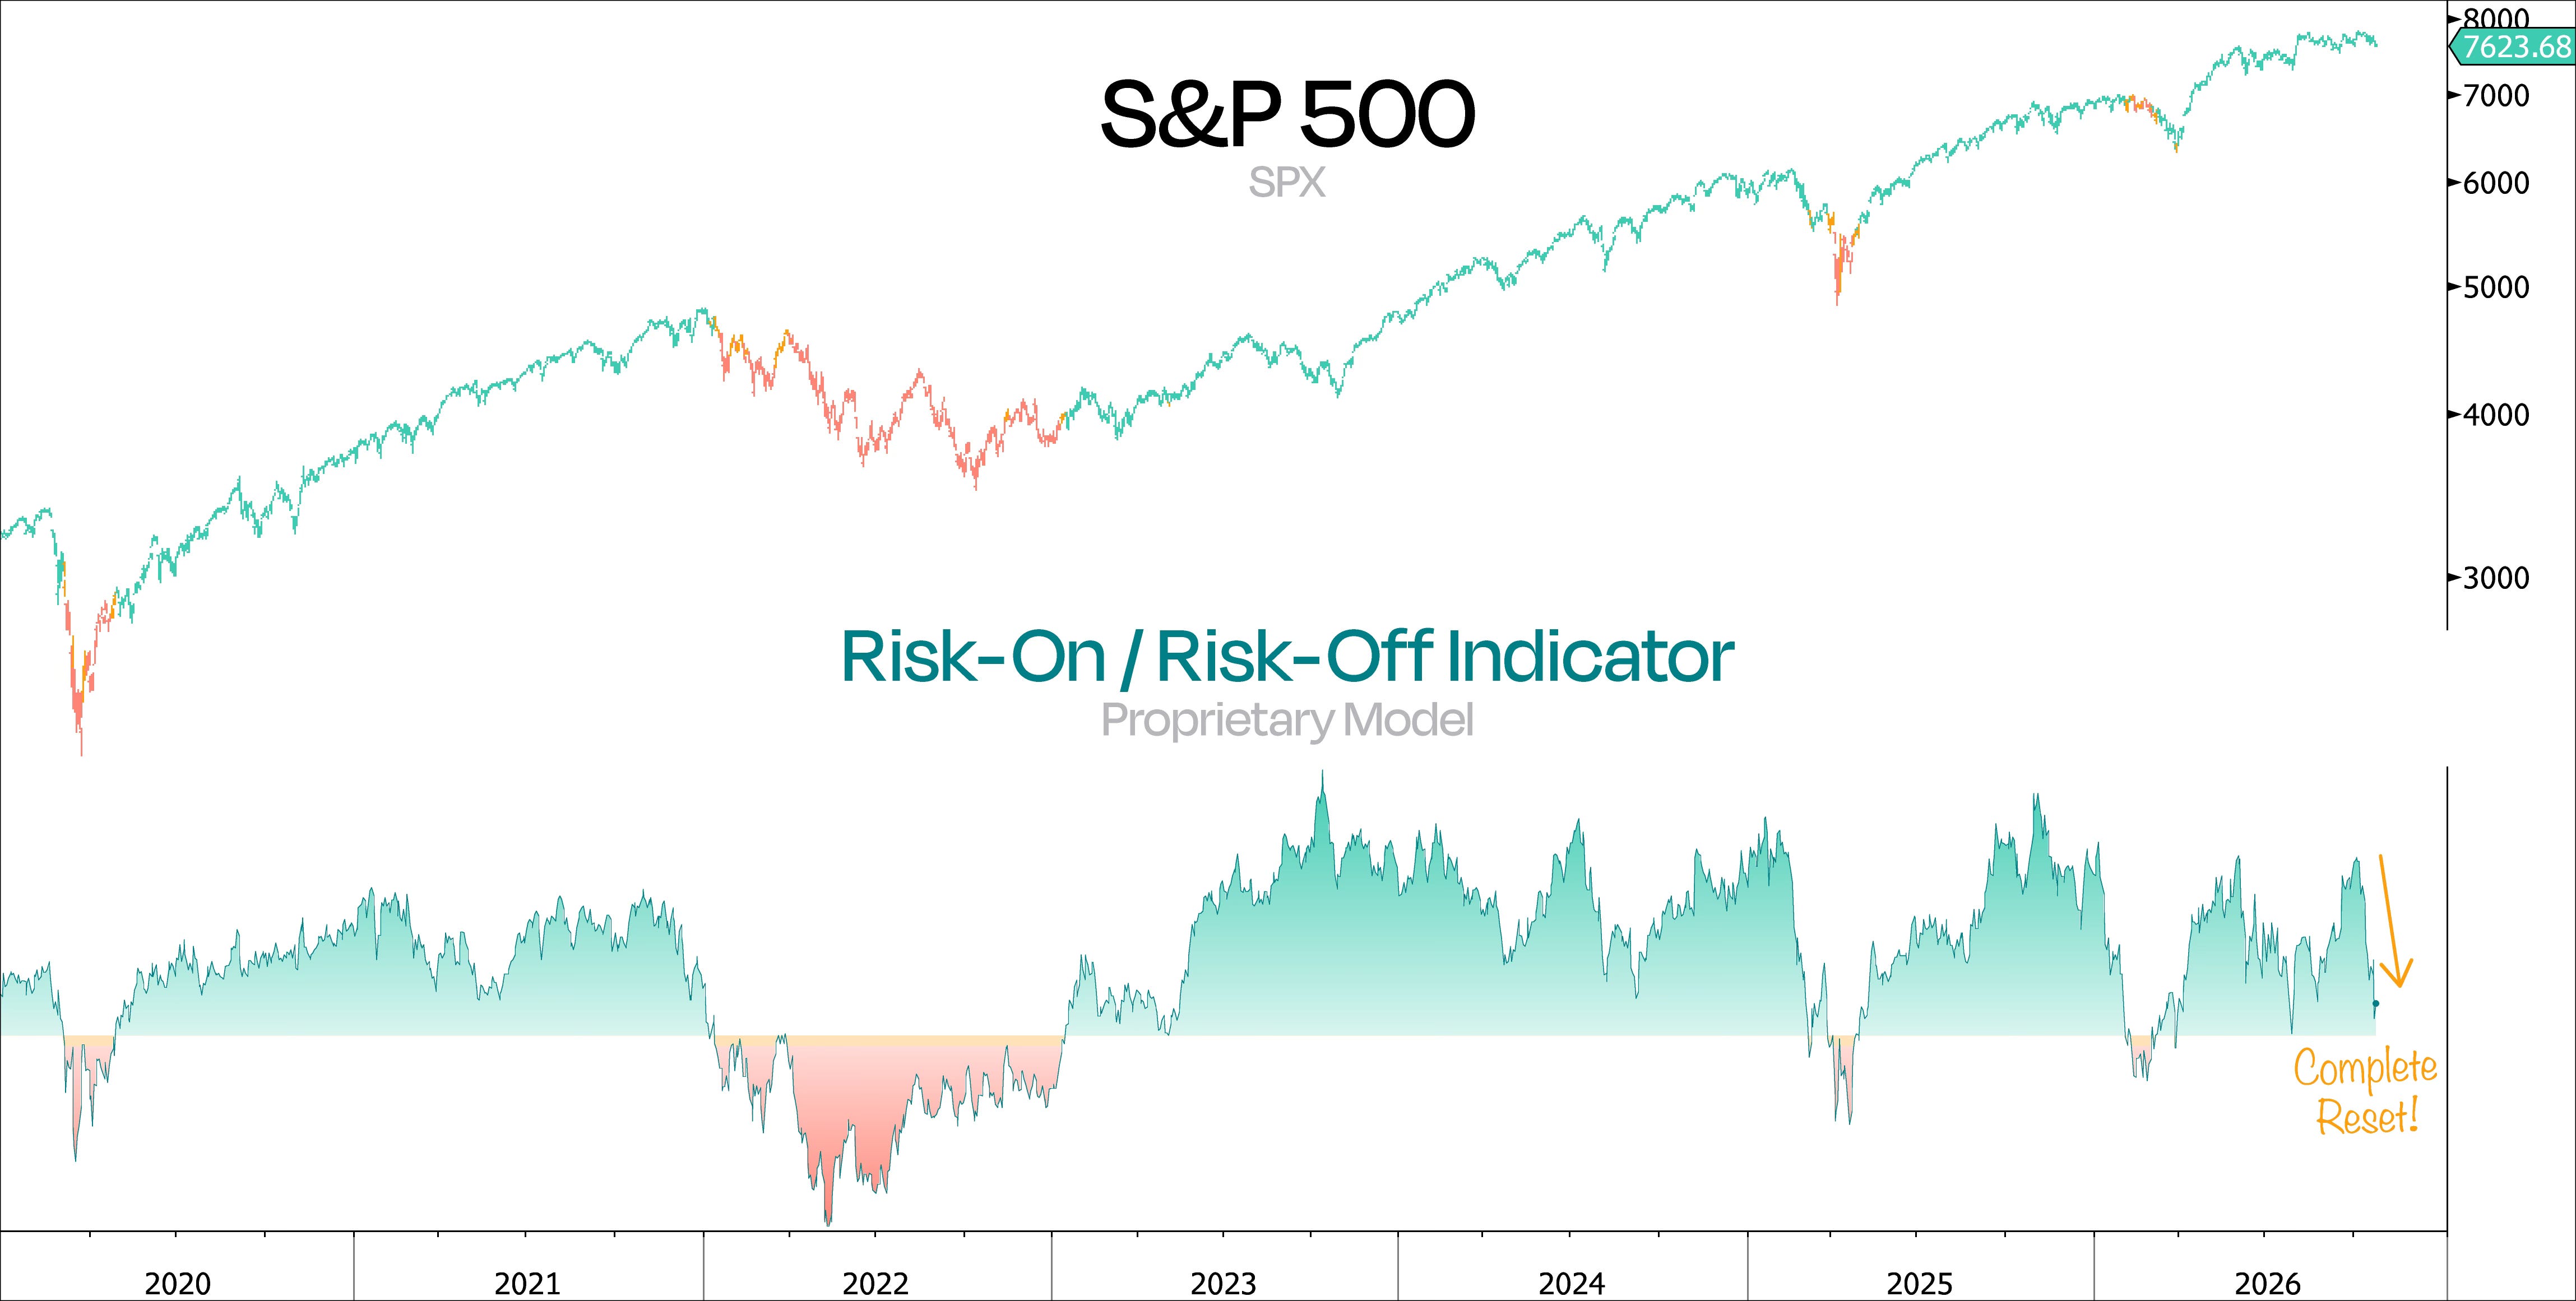
Back then, we pointed out how our Proprietary Risk Model had fallen from elevated levels back to essentially zero, which was already telling us something important: a lot of bad news had been priced in.
And that’s precisely what our Proprietary Risk Model is showing again today: an aggressive reset back toward neutral.
Now, based on what we’re seeing around here — or perhaps more importantly, what we’re not seeing — we’re inclined to view this as an opportunity zone rather than a panic point. Because if the market has already spent the past several weeks de-risking its highest-beta and most speculative corners, it also means there’s room for sentiment to improve again.
Having said all that, we do believe we’re getting closer to the final stages of this selloff, even if it has turned out to be a lot more intense than we initially expected. But with sellers showing signs of exhaustion and sentiment having been reset, we’re struggling to see a compelling reason for much more pain from here, particularly with the economy and earnings still growing at a decent pace.
Put simply, as long as the economy keeps growing, we’re inclined to stick with this bull market. And this looks like another scare along the way.
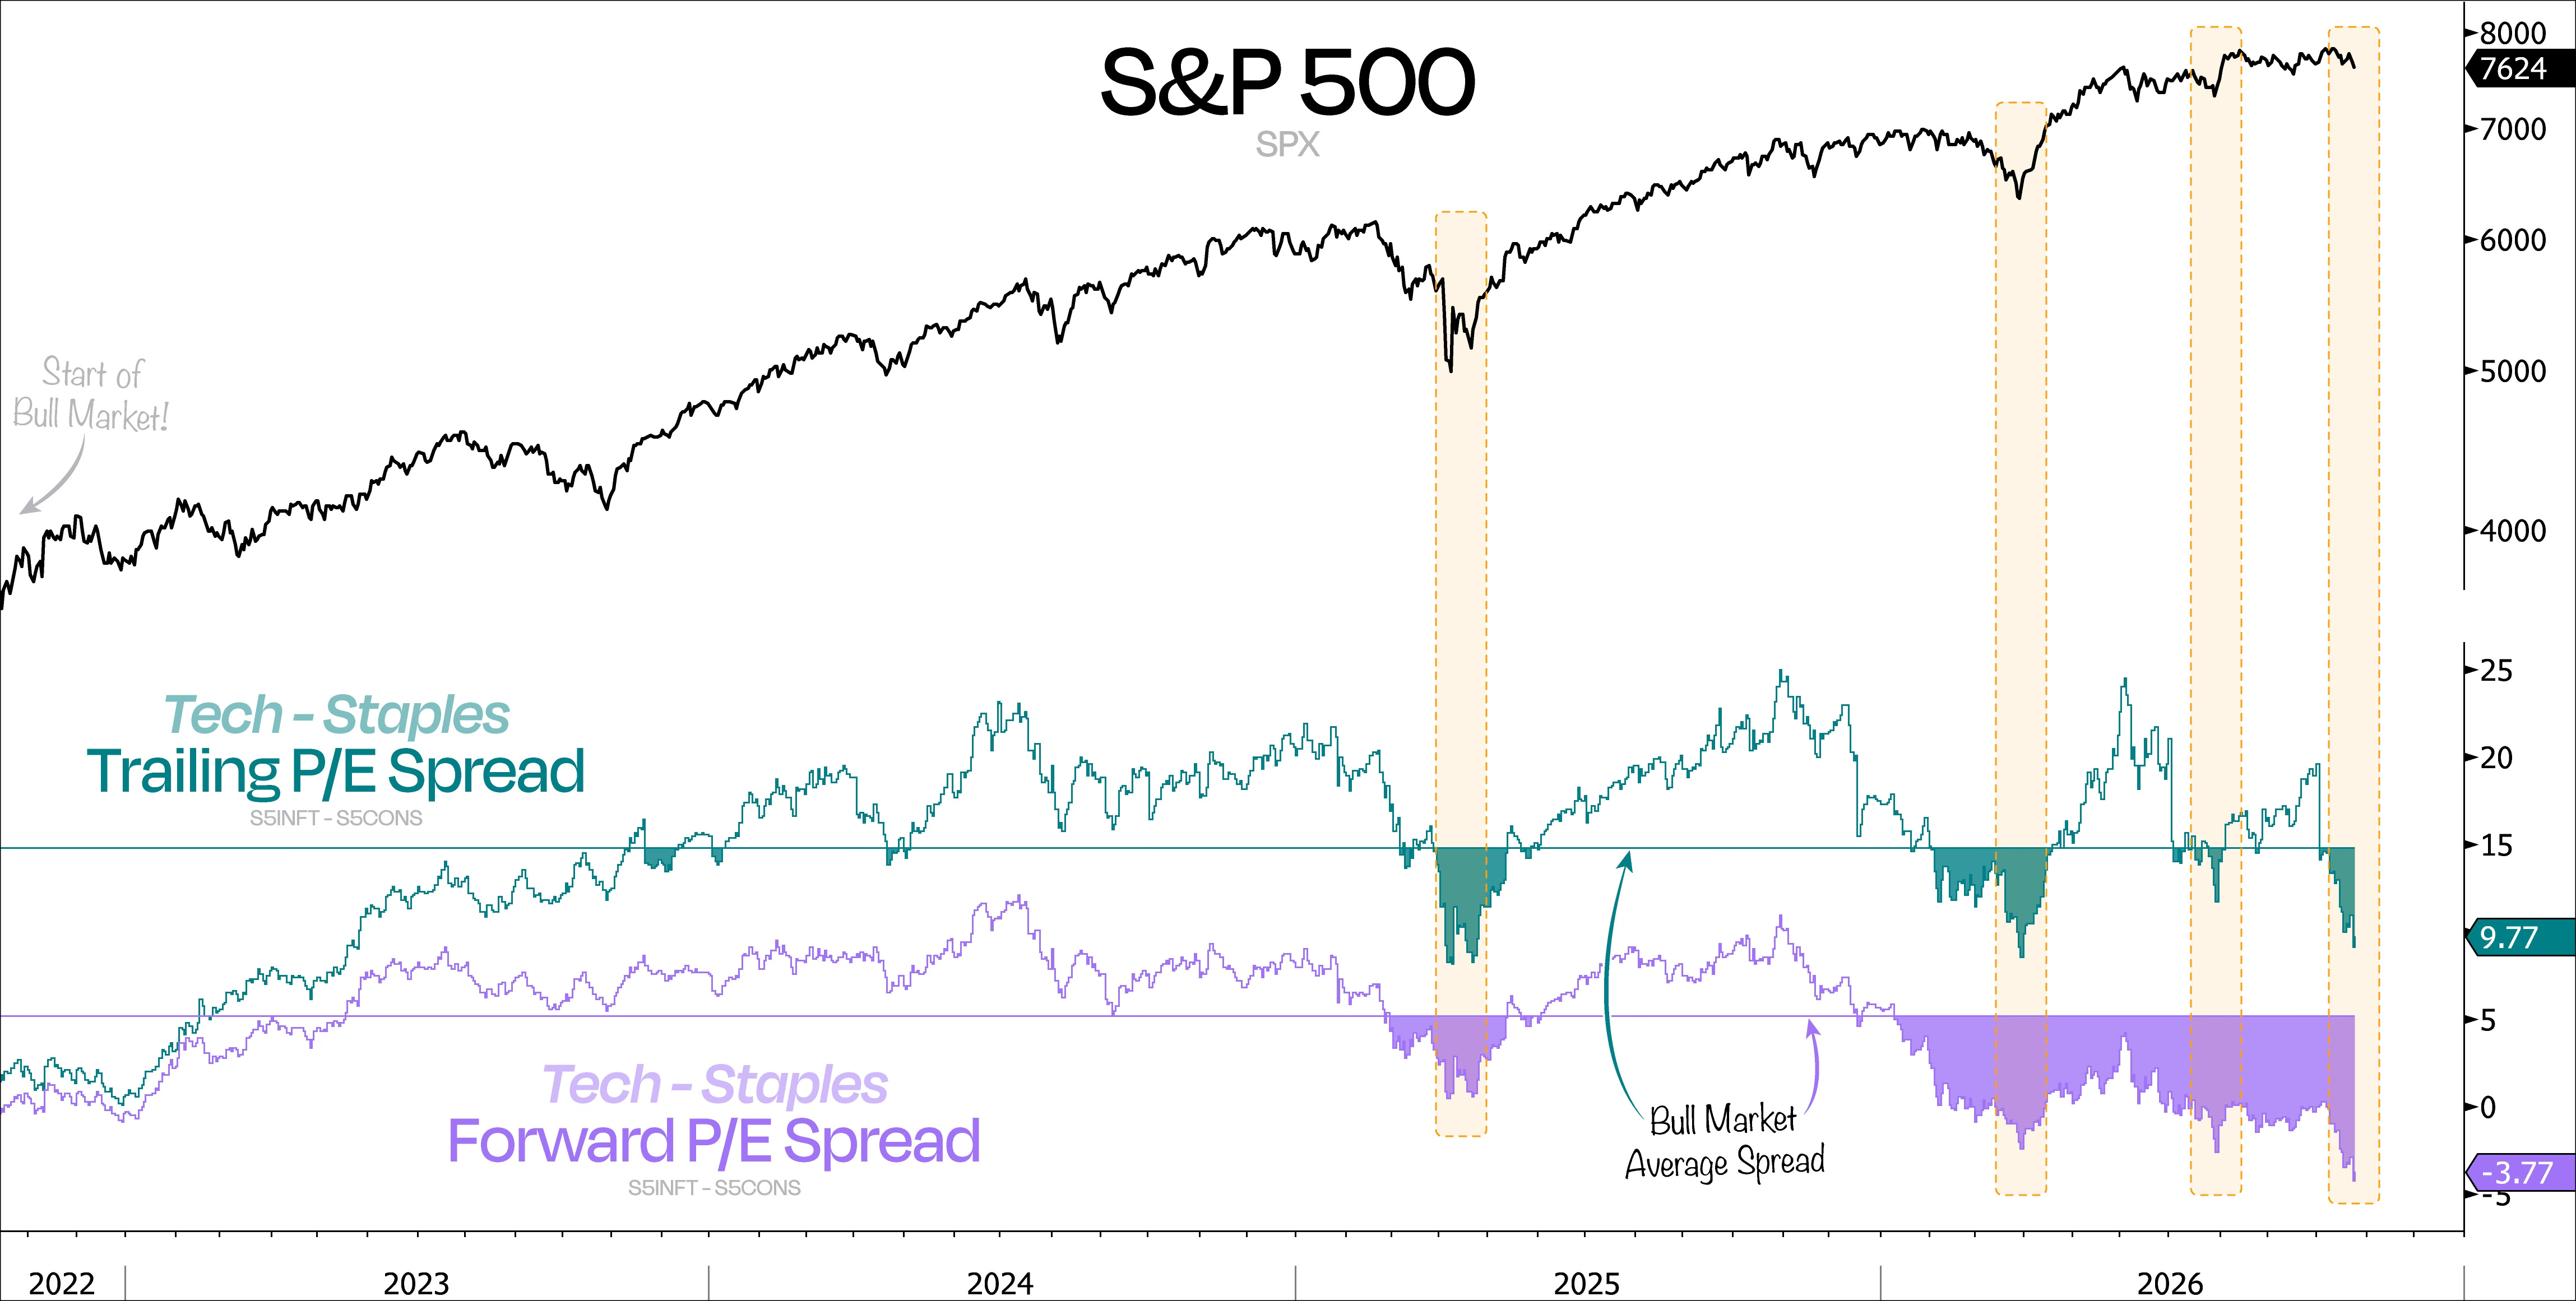
We can also see just how much damage this selloff has done by looking at the valuation spread between Tech and Staples, both on a trailing and forward basis. In both cases, the gap has compressed to levels comparable to some of the more aggressive resets we’ve seen in recent years.
On a trailing basis, the spread has fallen back to levels last seen during the tariff tantrum and the more recent Iran War selloff.
But it’s the forward basis that really stands out. The Tech vs Staples valuation spread has fallen to its most negative levels of this bull market, taking us all the way back to levels last seen in 2016.
As we’ve said before, we’re simply not seeing the kind of economic deterioration that could lead to a sharp slowdown in growth and, in turn, explain why this market should head materially lower from here.
In fact, one of the most important pillars of both the economy and this bull market is actually showing signs of a significant re-acceleration in growth. And so far, the market seems to be completely ignoring it…