


Good morning - Here’s an excerpt from the market section of today’s Opening Look note. Have a very happy Easter and Passover. Best, Frank
The Big Patterns
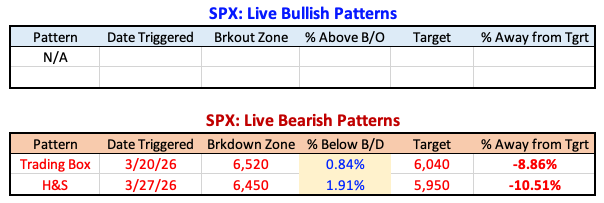
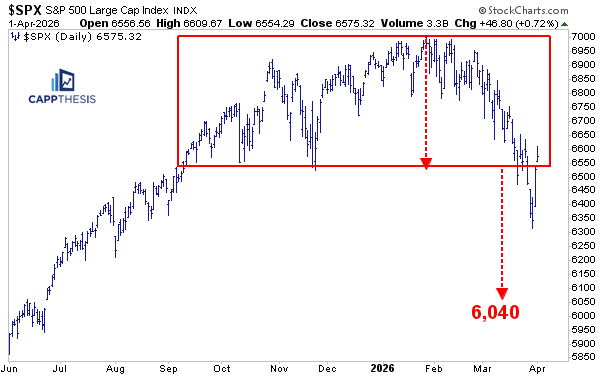
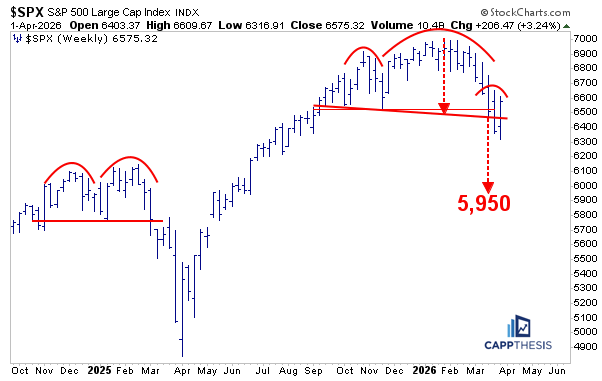
As of yesterday’s close, the SPX was trading above both breakdown zones of the bearish patterns we’ve been tracking. If this morning’s weakness continues throughout today, though, the index will be back below both of them.
GoNoGo – Counter Trend Buy Signal
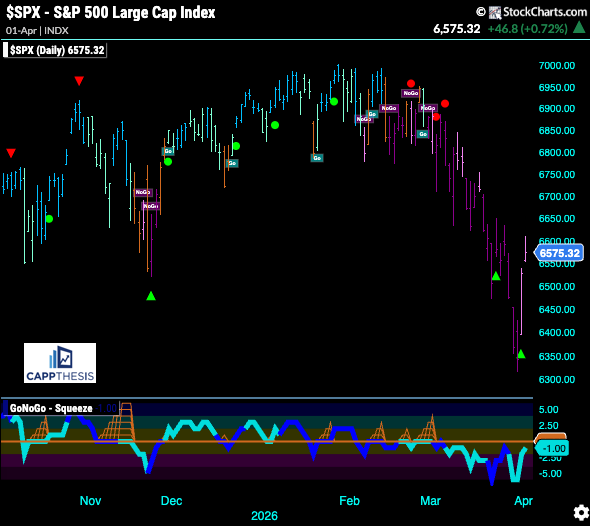
The GoNoGo chart remains in NoGo mode, with the only difference the last few days being that very bearish purple bars have now shifted to pink, indicating a less severe bearish trend.
We’ve also had another counter-trend buy signal (green triangle trigger) on Wednesday, and so far the SPX has done a better job of leveraging it compared to a week and a half ago. This will be put to the test again today, as well.
Short-Term
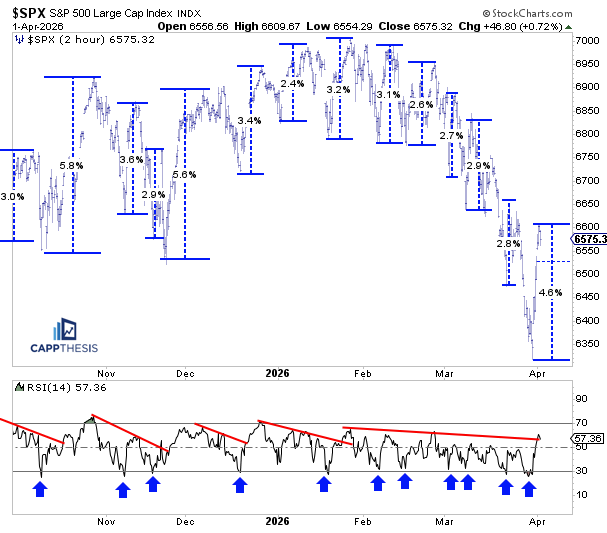
We’ve received a lot of questions on the short-term work given the strength of the two-day up-move. As is clear on the chart of the SPX, and the 14-period RSI below, not much has changed just yet. Of course, the near 5% advance is very strong—the strongest since late November to early December—but it has yet to alter the series of lower highs that has been in place since the late January peak.
The 14-period RSI reached its highest level since late February but still hasn’t pushed through the 60 level. The fact that momentum has remained below overbought territory since late December continues to be a very telling sign of the market’s overall trend.
Ideally, we’d like to see the indicator reach overbought territory as the SPX overtakes the last short-term high just above the 6,650 zone. That would improve the technical backdrop and increase the odds of the index being able to absorb a pullback and produce a higher low, which will be key going forward.
A Familiar Setup
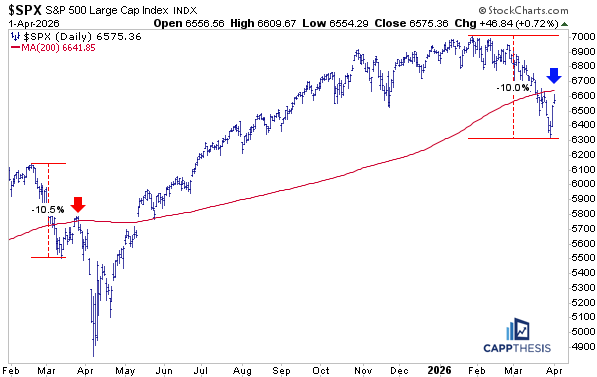
Zooming out, this is how the setup looks after the last few weeks. As we know, the pullback reached near correction territory, just shy of a 10% decline from the January high. Along the way, the SPX undercut its 200-day moving average for the first time in nearly a year. Despite a few sessions hovering near it, the index broke further below last week. Now, the rebound—totaling roughly 5%—has brought it right back toward that key level once again.
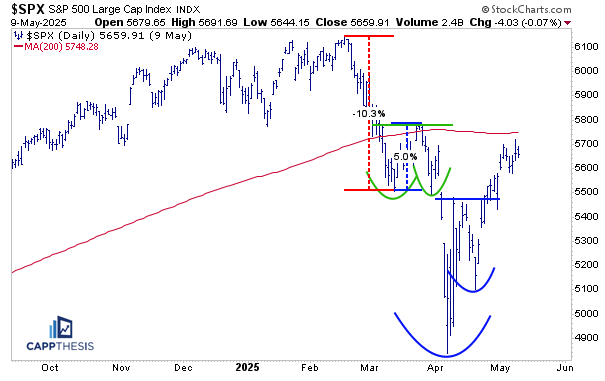
If this feels familiar, it should. A very similar sequence played out in 2025 from late February into early March. The SPX initially dropped, then rallied 10.5% during the month, briefly pushing above the 200-day moving average—but without any follow-through. That countertrend move ultimately resembled a bearish flag, which then resolved lower and led to a more severe second leg down.
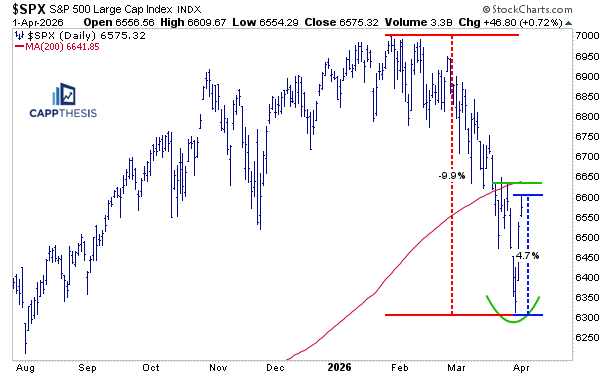
Zooming in, we can see what’s at stake here. The SPX doesn’t need to immediately reclaim the 200-day moving average for this to qualify as a successful bounce attempt. In fact, the reflexive move off the lows over the last few days is not the most important part—these sharp moves in both directions are typical in more stressful market environments.
What separates a bottoming formation from just a bear market rally is what happens after that initial face-ripping move. In other words, it’s all about the next round of profit-taking.
At this stage, forming a higher low is critical if this is going to evolve into a more constructive, bullish setup.
Looking back at that 2025 period, we can see exactly how this failed to materialize. In March, the first pullback after that ~5% rally took the SPX right back down toward the 5,500 level. Once that bounce failed, the potential for a bullish formation was effectively negated. Within a few days, the market dropped ~16% from the that March peak before ultimately making that climactic low on April 8th.
However, all was not lost. Even with that sharp, news-driven decline, the market’s rebound in early April did not go straight up. There was a sizable pullback in the second half of the month, but importantly, it produced a key higher low on April 21st. That was the turning point—buyers stepped in at higher levels, and it set the foundation for the advance that followed over the next several months.
These are two clear examples of how initial bottoming attempts can fail, and why patience matters. It’s less about trying to catch the exact low, and more about waiting for confirmation, because as we know, the lowest price can always become lower.
CappNotes offers a small window into the work we do at CappThesis - a technical analysis newsletter company focused on classical chart patterns, trend, and risk management. Explore the full range of CappThesis services here:
Something does feels awfully familiar. Posing the question this holiday weekend - Will lightening strike twice? Another V-shaped reversal from the 300 day simple moving average? https://kirkopps.com/r/T6G7qWd26