
The Bear Market Playbook

Introduction:
Investors,
If you’re reading this, it’s because I believe that Bitcoin’s bull market is over.
Or, more specifically, that the odds that we’ve entered a new bear market have risen significantly and has caused me to think, rather extensively, about survival.
And survival requires a very different mindset than “make money” mode.
There comes a point where the weight of evidence becomes too heavy to ignore and it’s necessary to confront the reality that markets objectively oscillate through phases.
They expand, distribute, contract, accumulate, and eventually trend higher again.
Just look at the Ark Next Generation Internet ETF ($ARKW) over the past 5 years:
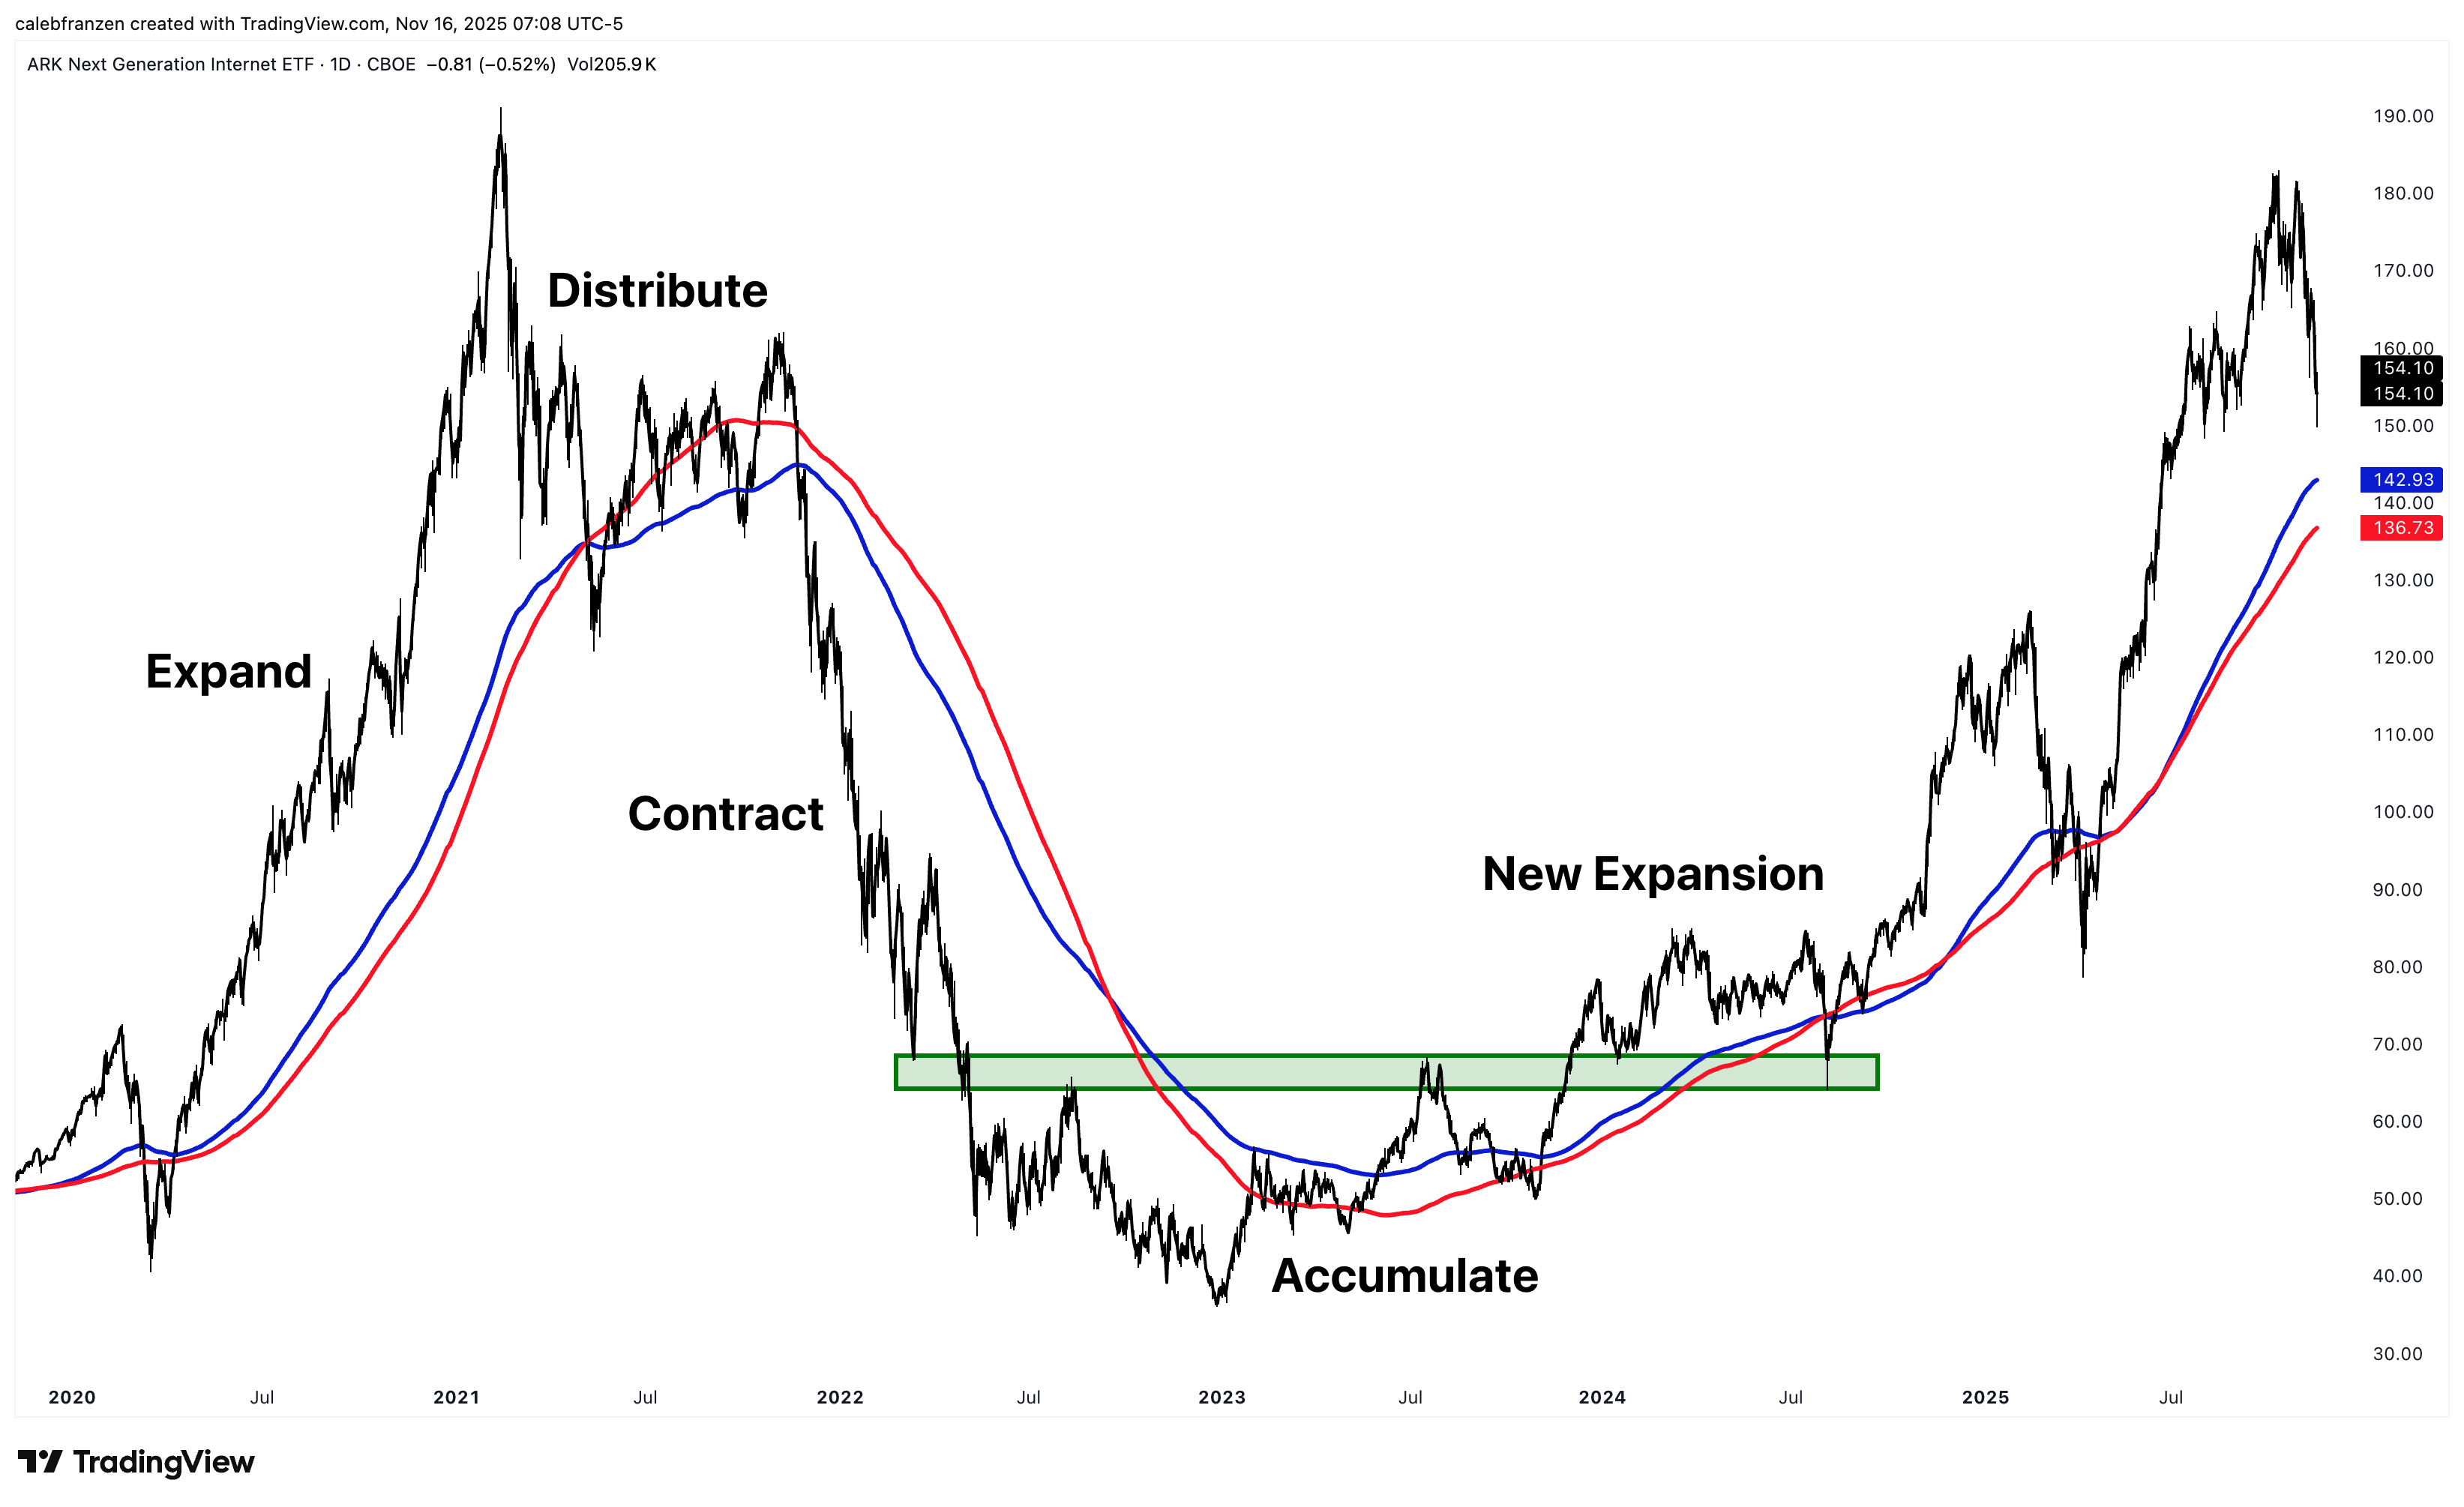
Each of these phases require different methodologies for being successful.
The challenge, of course, is knowing which phase we’re in at that moment, but this is where moving averages and price structure analysis become extremely meaningful.
That’s why I have the 200-day moving average cloud on the chart above, created with the exponential moving average in blue and simple moving average in red.
Whether we like it or not, markets rotate between risk on periods and risk off periods.
As it pertains to Bitcoin, both 2020 & 2021 were risk on periods.
2022 was a risk off period.
2023 through October 2025 has been a risk on period.
My research tells me that the risk on period has concluded and become risk off.
This shift is due to the breakdown below the 2-day 200 moving average cloud, which is something that I first discovered the power of in February 2025 and have consistently said “I will pronounce the end of the bull market if/when BTC breaks below its 2-day 200 MA cloud”.
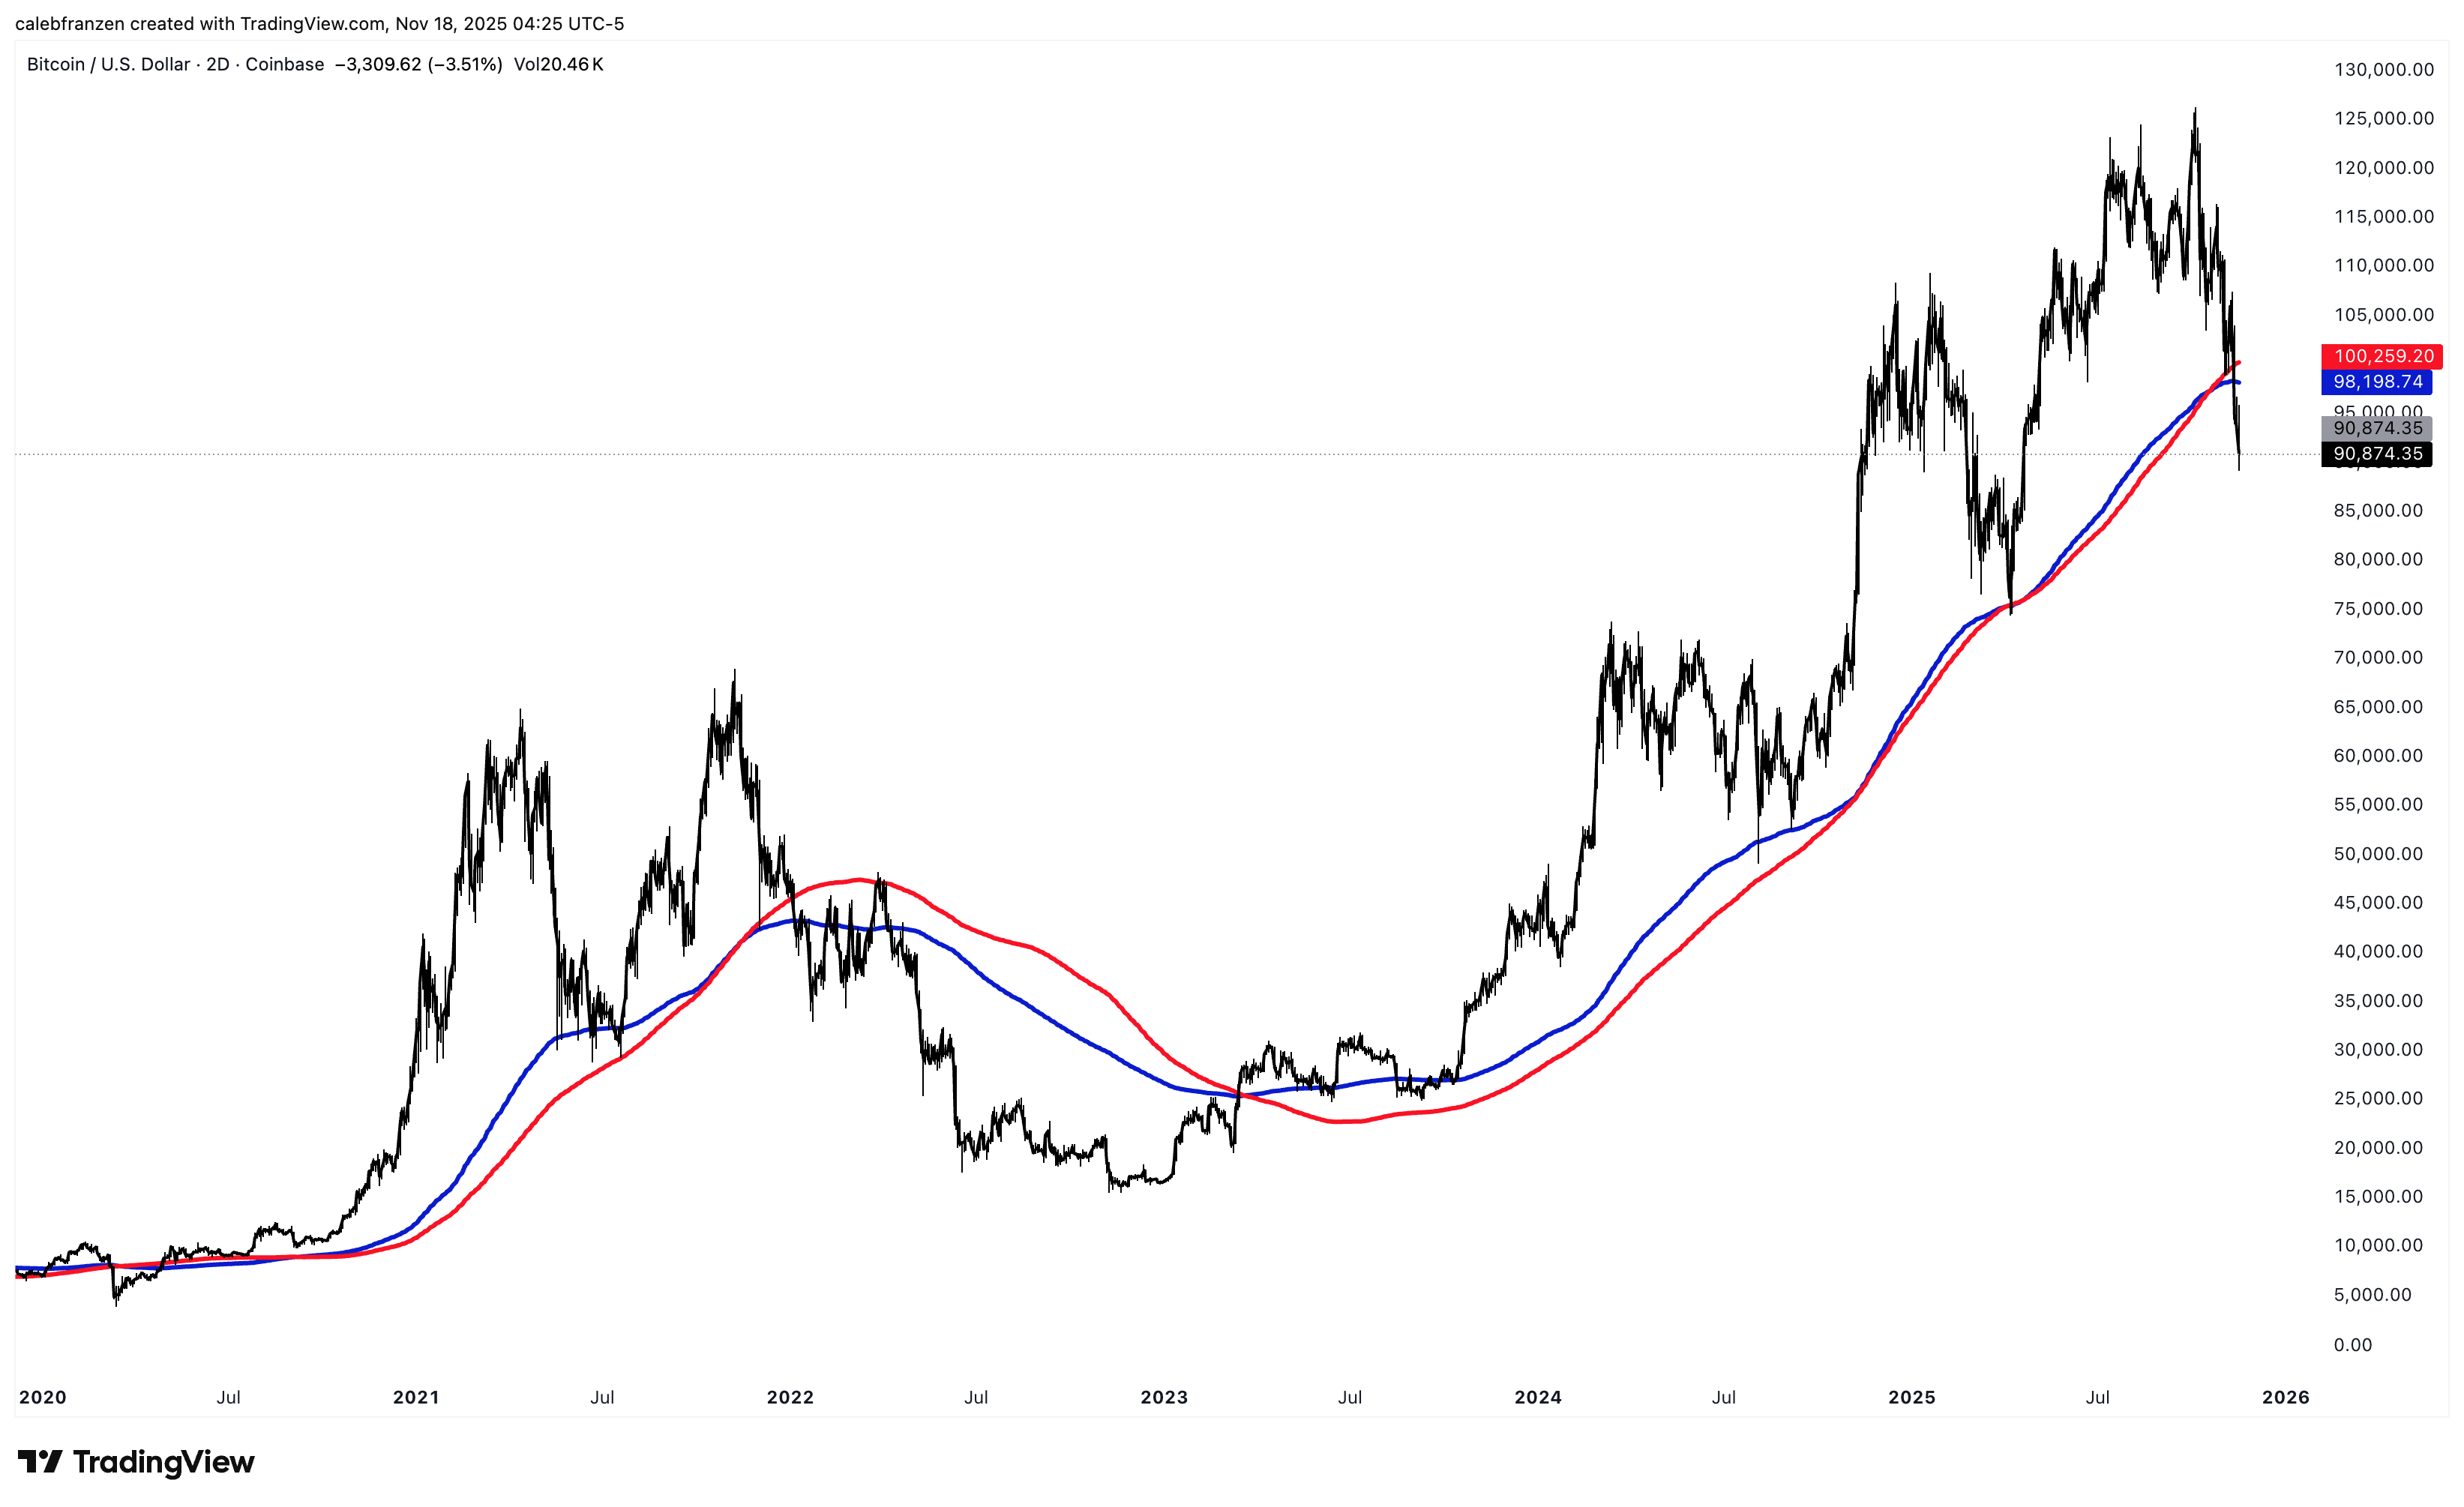
That breakdown officially occurred last Friday at $98.4k, with the 2-day close at $94.5k.
Exactly as I said I would, I sold a sizable amount of Bitcoin on that breakdown.
Before continuing this report, I want to be very clear about something…
Yes, right now I’m bearish and believe we’re in a new bear market for Bitcoin.
At the very least, the weight of the evidence suggests that we’re in a downtrend.
Since a bear market is just a sustained downtrend via the production of lower lows and lower highs, the ONE thing we don’t know is whether or not this new downtrend will be SUSTAINED or short-lived.
This is the challenge.
With trend-following, we must objectively recognize that trends can change.
That’s why so much of my work is dependent on identifying the trend and then thinking about what would invalidate it.
No one knows how long the downtrend will last.
We can try to quantify it using backtested data and determine an average.
In this current case, Bitcoin has fallen -58.5% over the course of 228 days, on average, after breaking below its 2-day 200 moving average cloud.
That’s the data that I’ve shared in the past and the data that I’ll reiterate now.
Unfortunately, this limited sample is all we have.
So we can recognize that the sample is limited (and therefore potentially flawed), but it’s the only thing we have in the current context to provide a blueprint for potential outcomes.
This would, in theory, bring Bitcoin to a price of $40,700 by June 30, 2026.
That isn’t my official prediction, but it’s something to think about.
Next, we need to recognize that this entire report could be completely useless and invalidated if one simple thing happens: price > 2-day 200 moving average cloud.
It won’t be a perfect indicator that the bull market is back on.
Maybe the 100 or 200-day MA cloud itself will be better options.
We don’t know.
But, as I say all the time with dynamic indicators like EMAs, we can repeatedly flip our bias depending on where price is relative to that moving average so that we stay aligned within the trend.
This is why I felt comfortable to sell a chunk of Bitcoin on this breakdown.
My “cost” of being wrong is buying back the exposure ~5% higher than I sold it.
My reward for being right is avoiding the majority of the potential -58% decline.
And let me also be clear, I did not sell all of my Bitcoin.
I didn’t even sell half.
But that’s all the detail that I’m comfortable sharing, for now.
So, if Bitcoin manages to get back above the 2-day 200 MA cloud, I’ll publicly announce that Bitcoin is back in a bull market and that this “Bear Market Playbook” is no longer necessary.
But that might take 3 months.
Or maybe 1 year.
Again, we don’t know.
But if/when it does happen, we know what to do — realign with the uptrend.
Okay, let’s continue talking about risk on vs. risk off periods…
In a nuanced world, there are also short-term risk off periods within the context of a long-term risk on period.
This is what I thought we were experiencing since mid-October.
Clearly, I was wrong… which we can only know in hindsight.
The scenario that I just described (ST risk off during LT risk on) is characteristic of a bull market, so the reason why I don’t think we’re in a ST risk off period within the context of a LT risk on period is because the data says we’re no longer in a bull market.
This is just the logically consistent way of explaining these market dynamics.
Based on the assumption that we’re now in a bear market, it’s important to recognize that the inverse is a scenario where brief risk on periods occur within the context of a broader risk off period.
We can call these “counter-trend rallies” or “dead cat bounces” or even “mean reversions”.
A bull market makes everyone feel like a genius. The market feels like it’s on “easy mode” and even poorly-timed purchases can turn into profitable investments due to a market environment where a rising tide lifts all boats.
A bear market reveals who can think clearly while others panic.
I’m not saying we should feel good during a downtrend.
But we must embrace these periods.
This playbook is written for long-only investors who are willing to embrace short (or even medium-term) pain in favor of achieving long-term gains. If you’re a trader and you want to take advantage of this market environment, the solution is simple… do the inverse of everything you did successfully in the bull market.
Short at structural & dynamic resistance.
Close shorts at/below structural & dynamic support.
For long-only investors, the path forward is more complex (psychologically) and technically.
So maybe you’re like me and you reduced your exposure on the recent breakdown…
How do we buy that exposure back?
When will DCA purchases be more favorable?
How long should our DCA window be?
Should we get more aggressive at certain levels?
This report is for you.
It’s written for long-only investors who don’t hedge, who don’t short, and who don’t want to turn their portfolio into an anxiety-inducing trading project. It’s written for people who understand that timing the exact bottom is impossible, but preparing for the broad shape and emotional landscape of a bear market is absolutely achievable.
It’s written for people who know they need a strategy that is not only rational and evidence-based, but psychologically sustainable.
The bear market isn’t just a financial cycle.
It’s a stamina test.
And the analysis in this report exists to ensure that you win it.
If you want to win while other investors struggle, this Bear Market Playbook is for you.
Let’s begin…