
Revealing My Entire Portfolio
Quarterly Portfolio Deep-Dive

Investors,
I’m about to share my entire stock market portfolio, with full transparency.
But before we get into all of my holdings and my general investing plans in the months ahead, I want you to look at this signal from the CBOE Volatility Index (VIX):
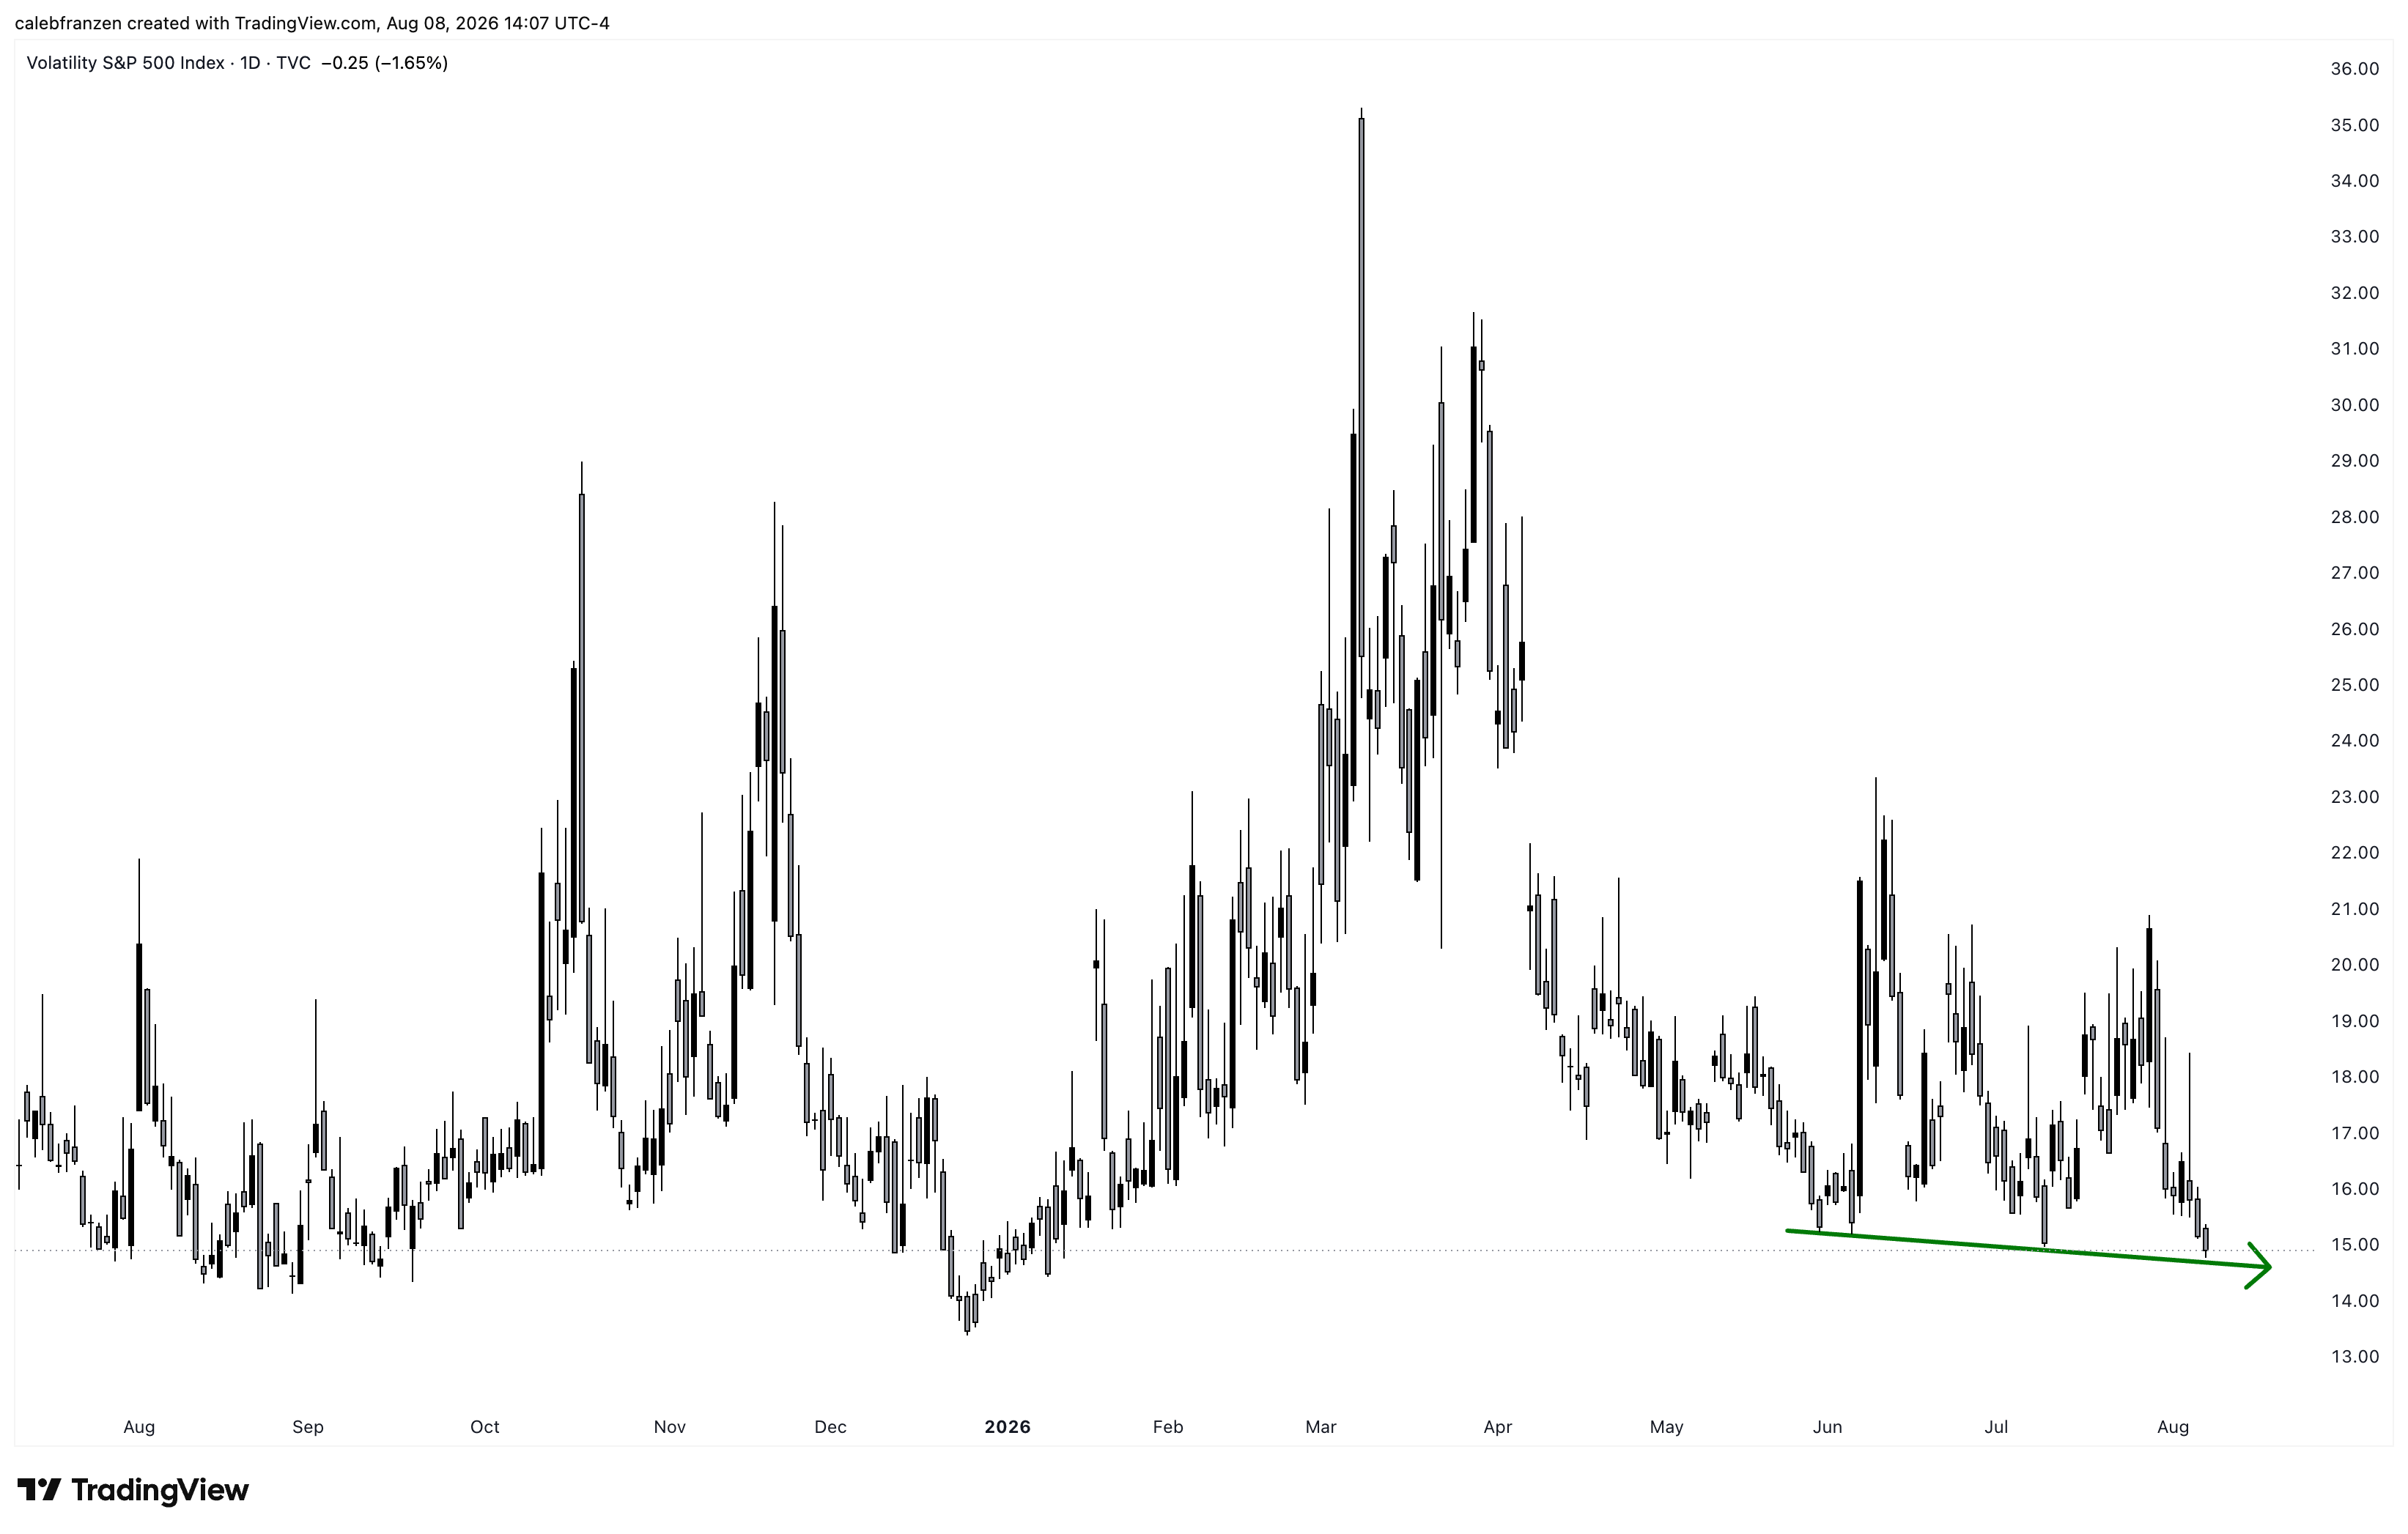
The VIX just had its lowest daily close since January 9, 2026.
I don’t think that’s insignificant…
In fact, I think it’s one of the most significant developments in the entire market.
Why?
If we invert the VIX and add the S&P 500 to the bottom pane, we uncover an important relationship, in which divergences between the two can foreshadow major corrections.
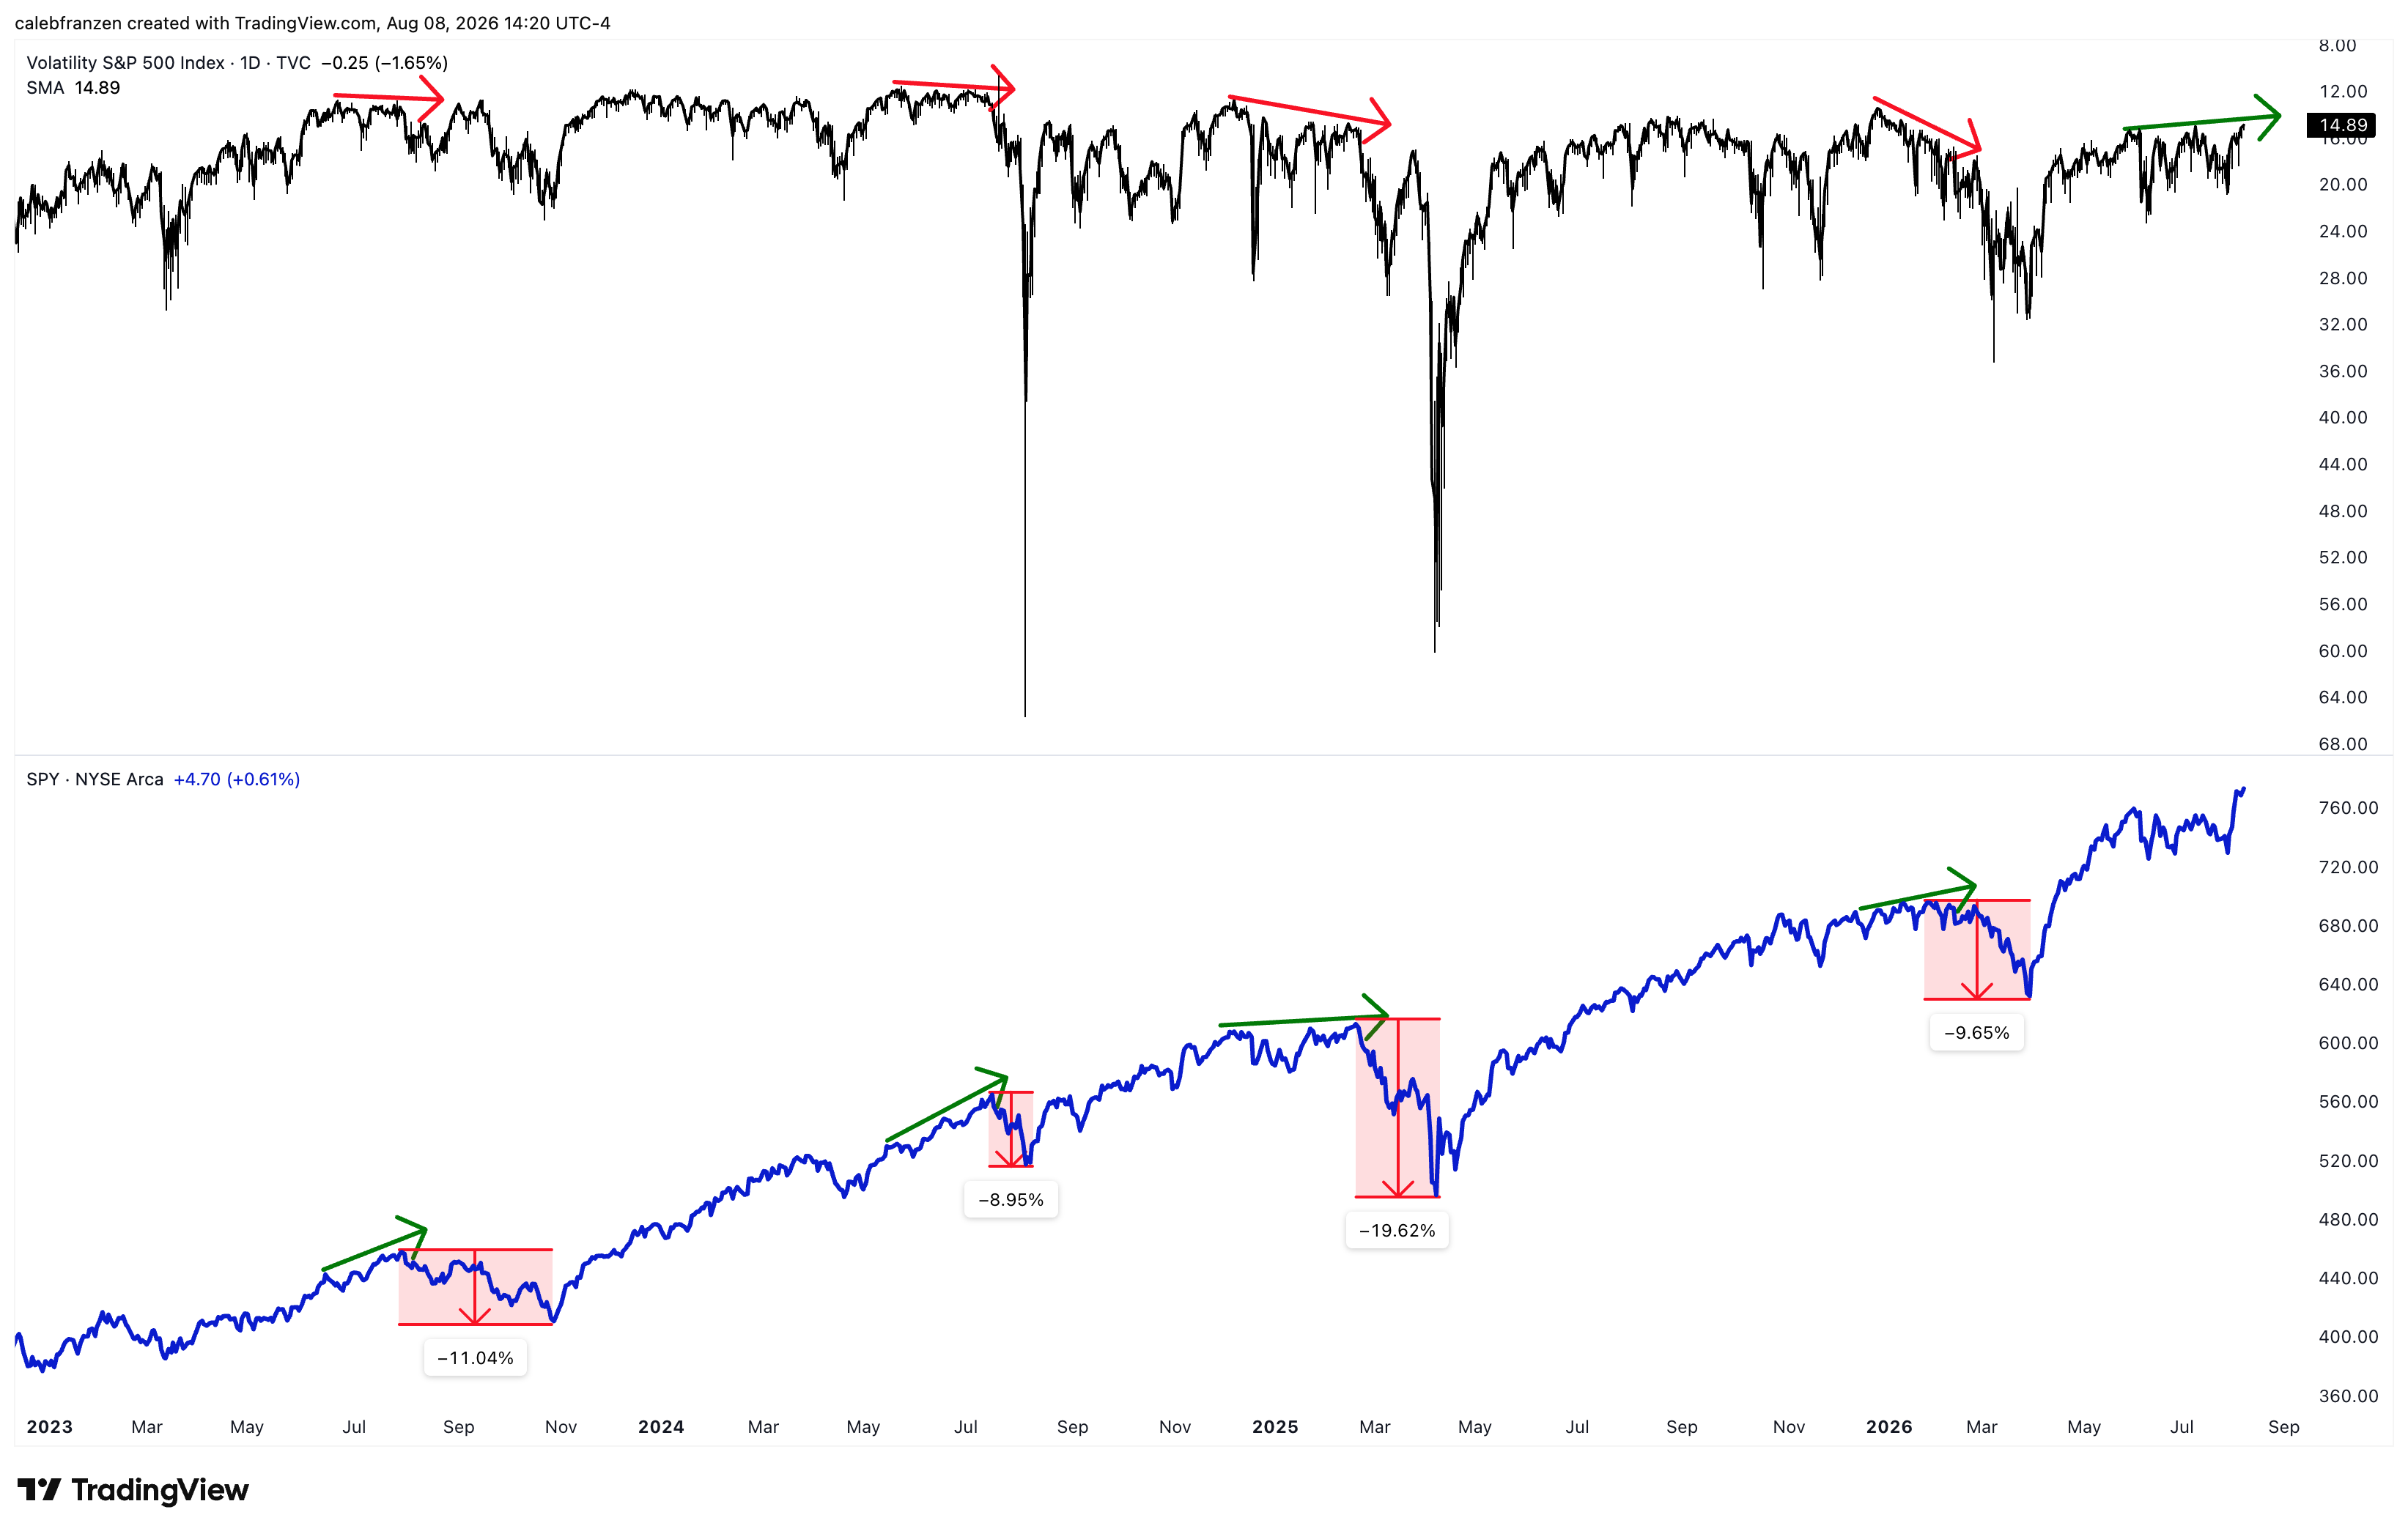
In fact, EVERY major correction for the S&P 500 over the course of this bull market has occurred AFTER a divergence in which the VIX failed to produce lower lows (or in the case of this inverted chart, higher highs) while the index made higher highs.
Therefore, as we look at this relationship in the current environment, the lack of a divergence between the VIX and the S&P 500 tells me that this recent breakout to new all-time highs has legs.
Particularly in an environment where junk bonds are also breaking out and confirming the uptrend in equities. In other words, the lack of a bearish divergence in both volatility and junk bonds relative to the stock market is HIGHLY bullish.
I’m not going to fade these developments…
But that’s just me.
Sincerely, the guy whose portfolio is up +31% YoY using this exact type of analysis to make active portfolio decisions & manage risk.
Without further ado, here’s what I own and what I plan to do next…