

Investors,
I’m going to make this short, sweet, and extremely effective.
And I’m going to tell you why one of the most boring topics in financial markets is about to be the biggest source of alpha that you’ll find in the market right now.
Whether you’re a stock investor or a crypto investor, you need to know about this.
It’s concerning.
It has major repercussions.
And the investors who don’t know about this will wish they did.
This report is 100% free, so please share it with the investors you care about.
Bond market volatility.
I’m sure your eyes just glazed over, but bare with me.
Specifically, the MOVE Index is the U.S. Bond Market Option Volatility Estimate Index.
I don’t know what it is, how it’s measured, or the details of the index.
But I actually don’t care to be honest.
I only care about what it’s doing & how I can exploit it.
All I know is that the bond market is enormous (significantly larger than the equity market) and that interest rates are extremely important. If bonds are just a function of interest rates, then the MOVE essentially tracks interest rate volatility (and therefore reflects uncertainty in the market).
So this is it…
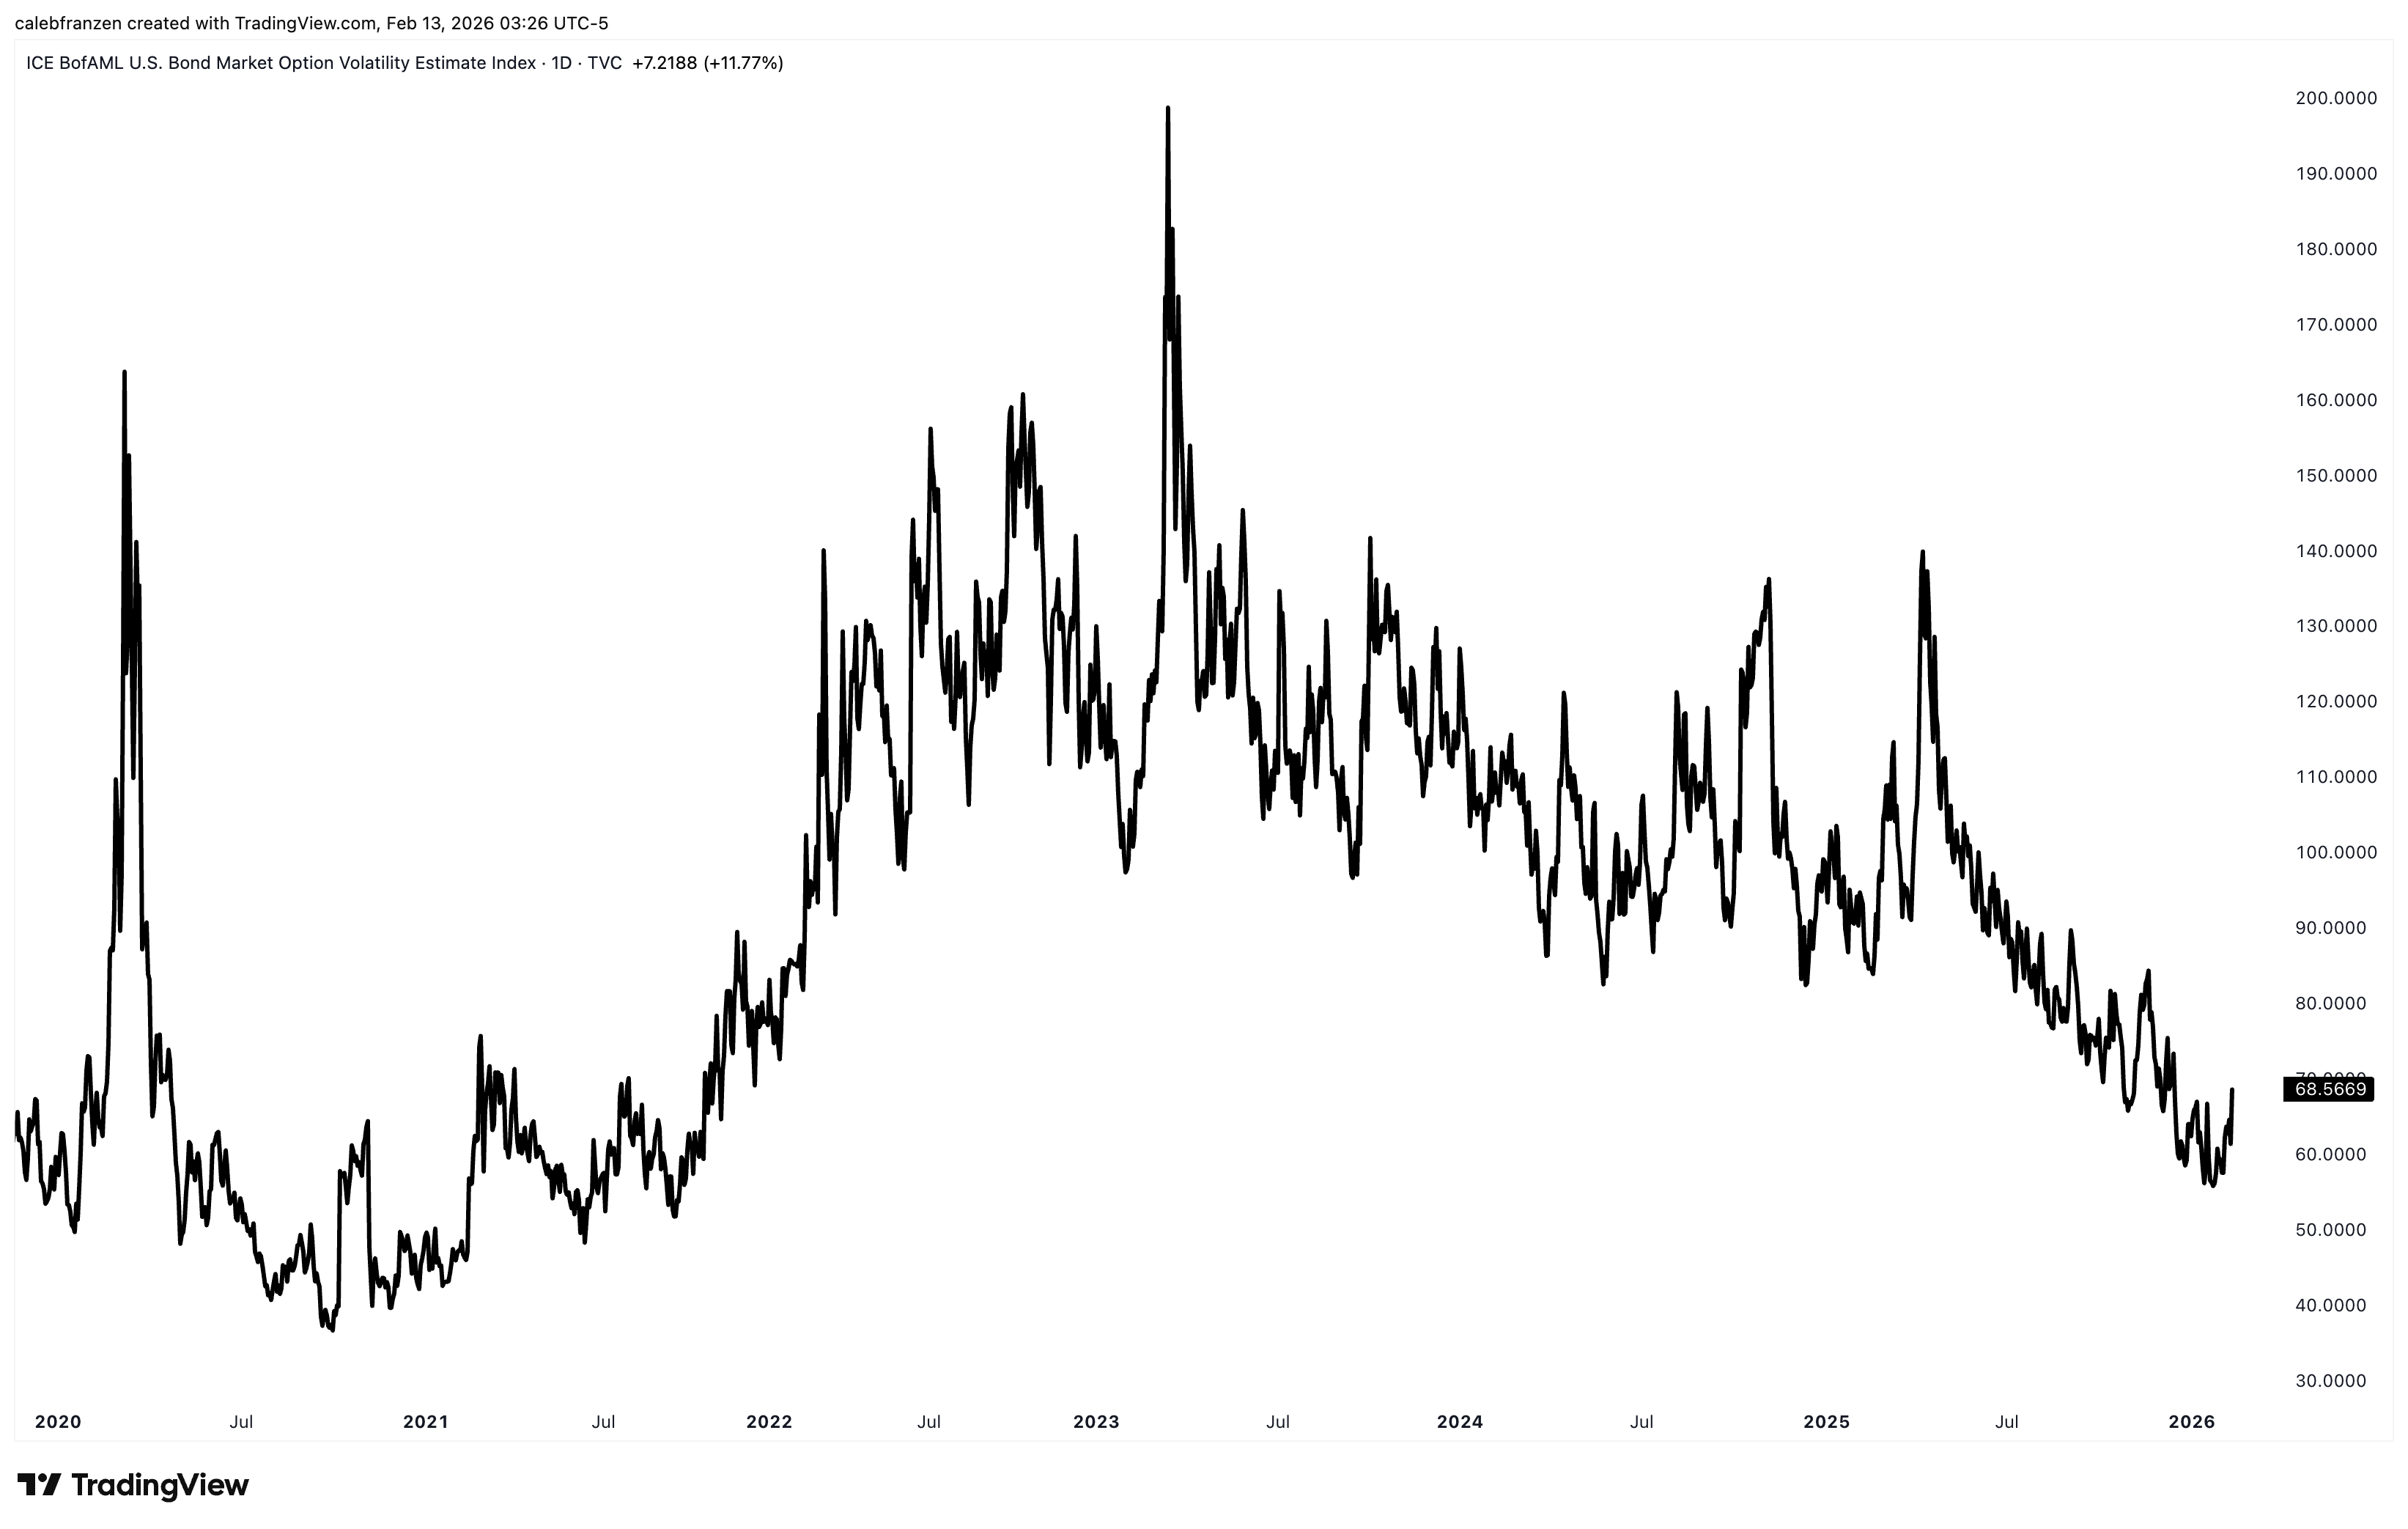
Bond market volatility peaked in March 2023, in immediate response to the banking “crisis” and has been steadily declining ever since after a monumental rise in 2022.
Logically, as we might expect, higher volatility is bad for the market.
But let’s actually put that to the test by flipping everything on its head…
If higher volatility is bad, then lower volatility must be good for the market.
So if we invert the MOVE Index and then add the S&P 500 in the lower pane, get this:
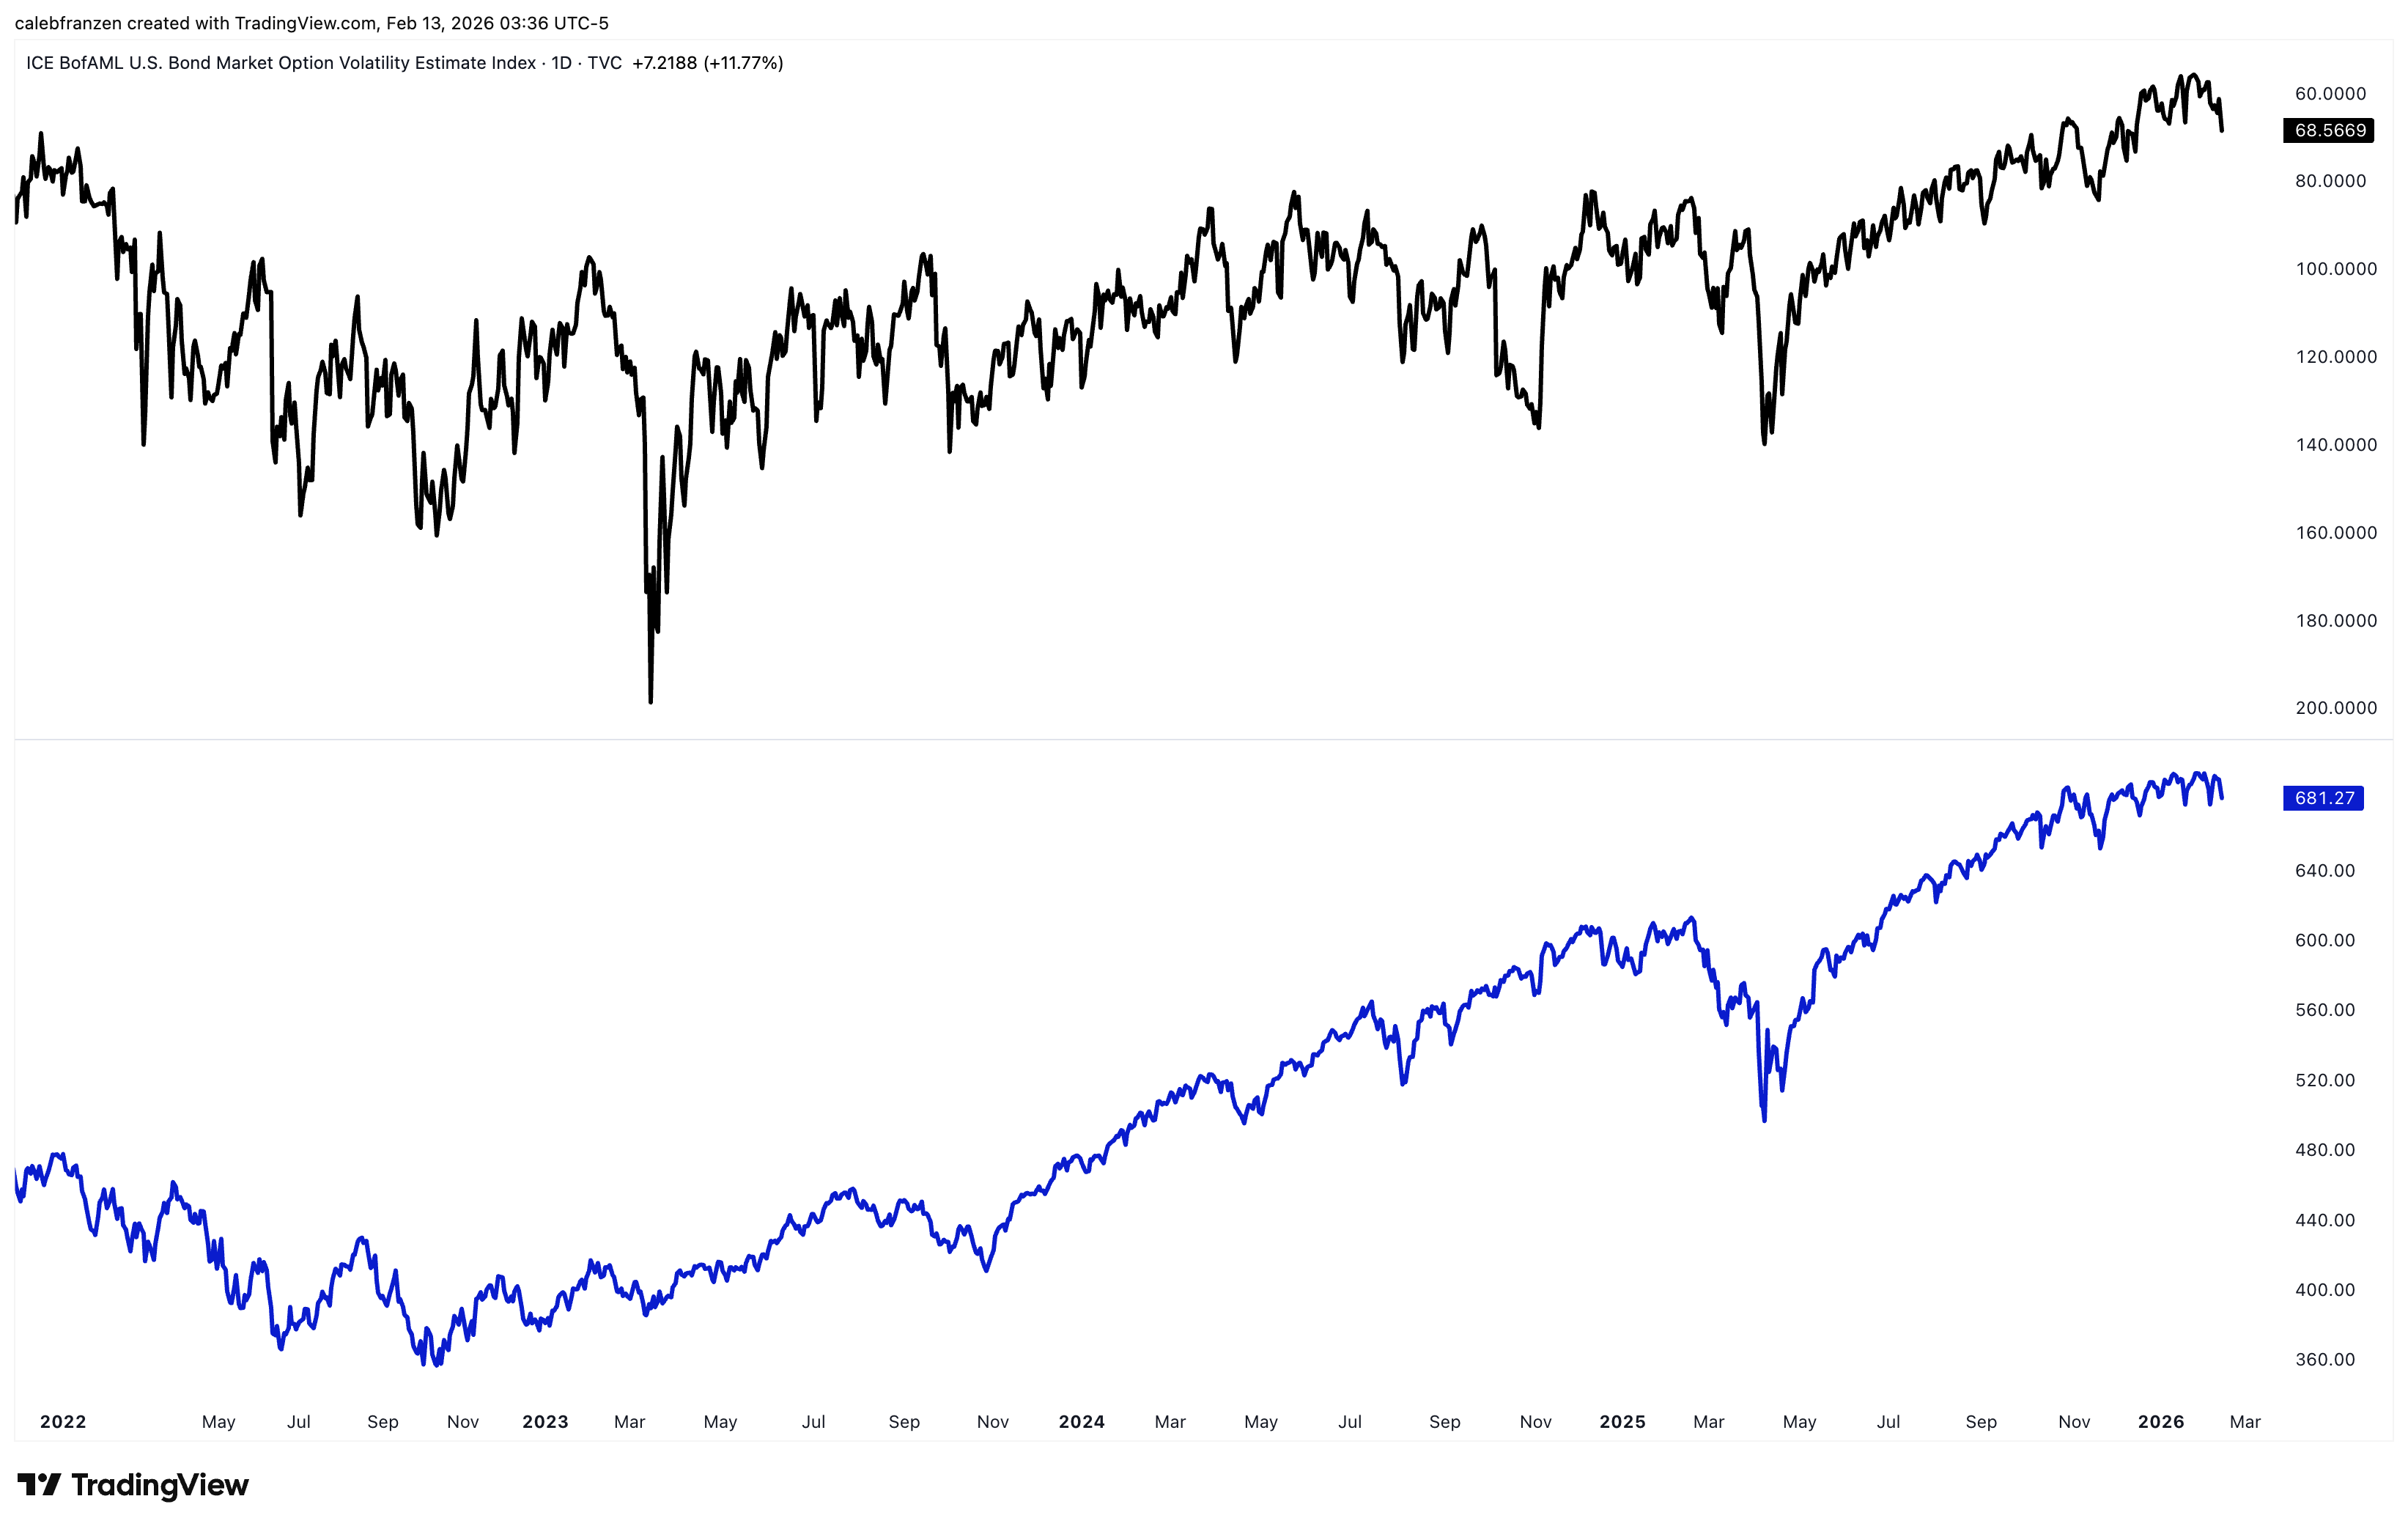
Sure enough, there are similarities in the behavior of each instrument!
They are different markets (bond vol doesn’t necessarily translate to equity returns), but the intertwining of the financial system makes them have enough of a correlation.
But then I noticed something interesting…
If these instruments are correlated enough, then what happens when they diverge?
In other words, what happens when the bond market disagrees with the S&P 500?
What happens when bond market volatility sees something that stock investors don’t?
Using the chart that I shared directly above, I wanted to find divergences where:
The S&P 500 was making higher highs (confirming the uptrend)
The MOVE Index was making lower highs (diverging from the stock market)
Since the bull market began in Q4 2022, these are all such instances:
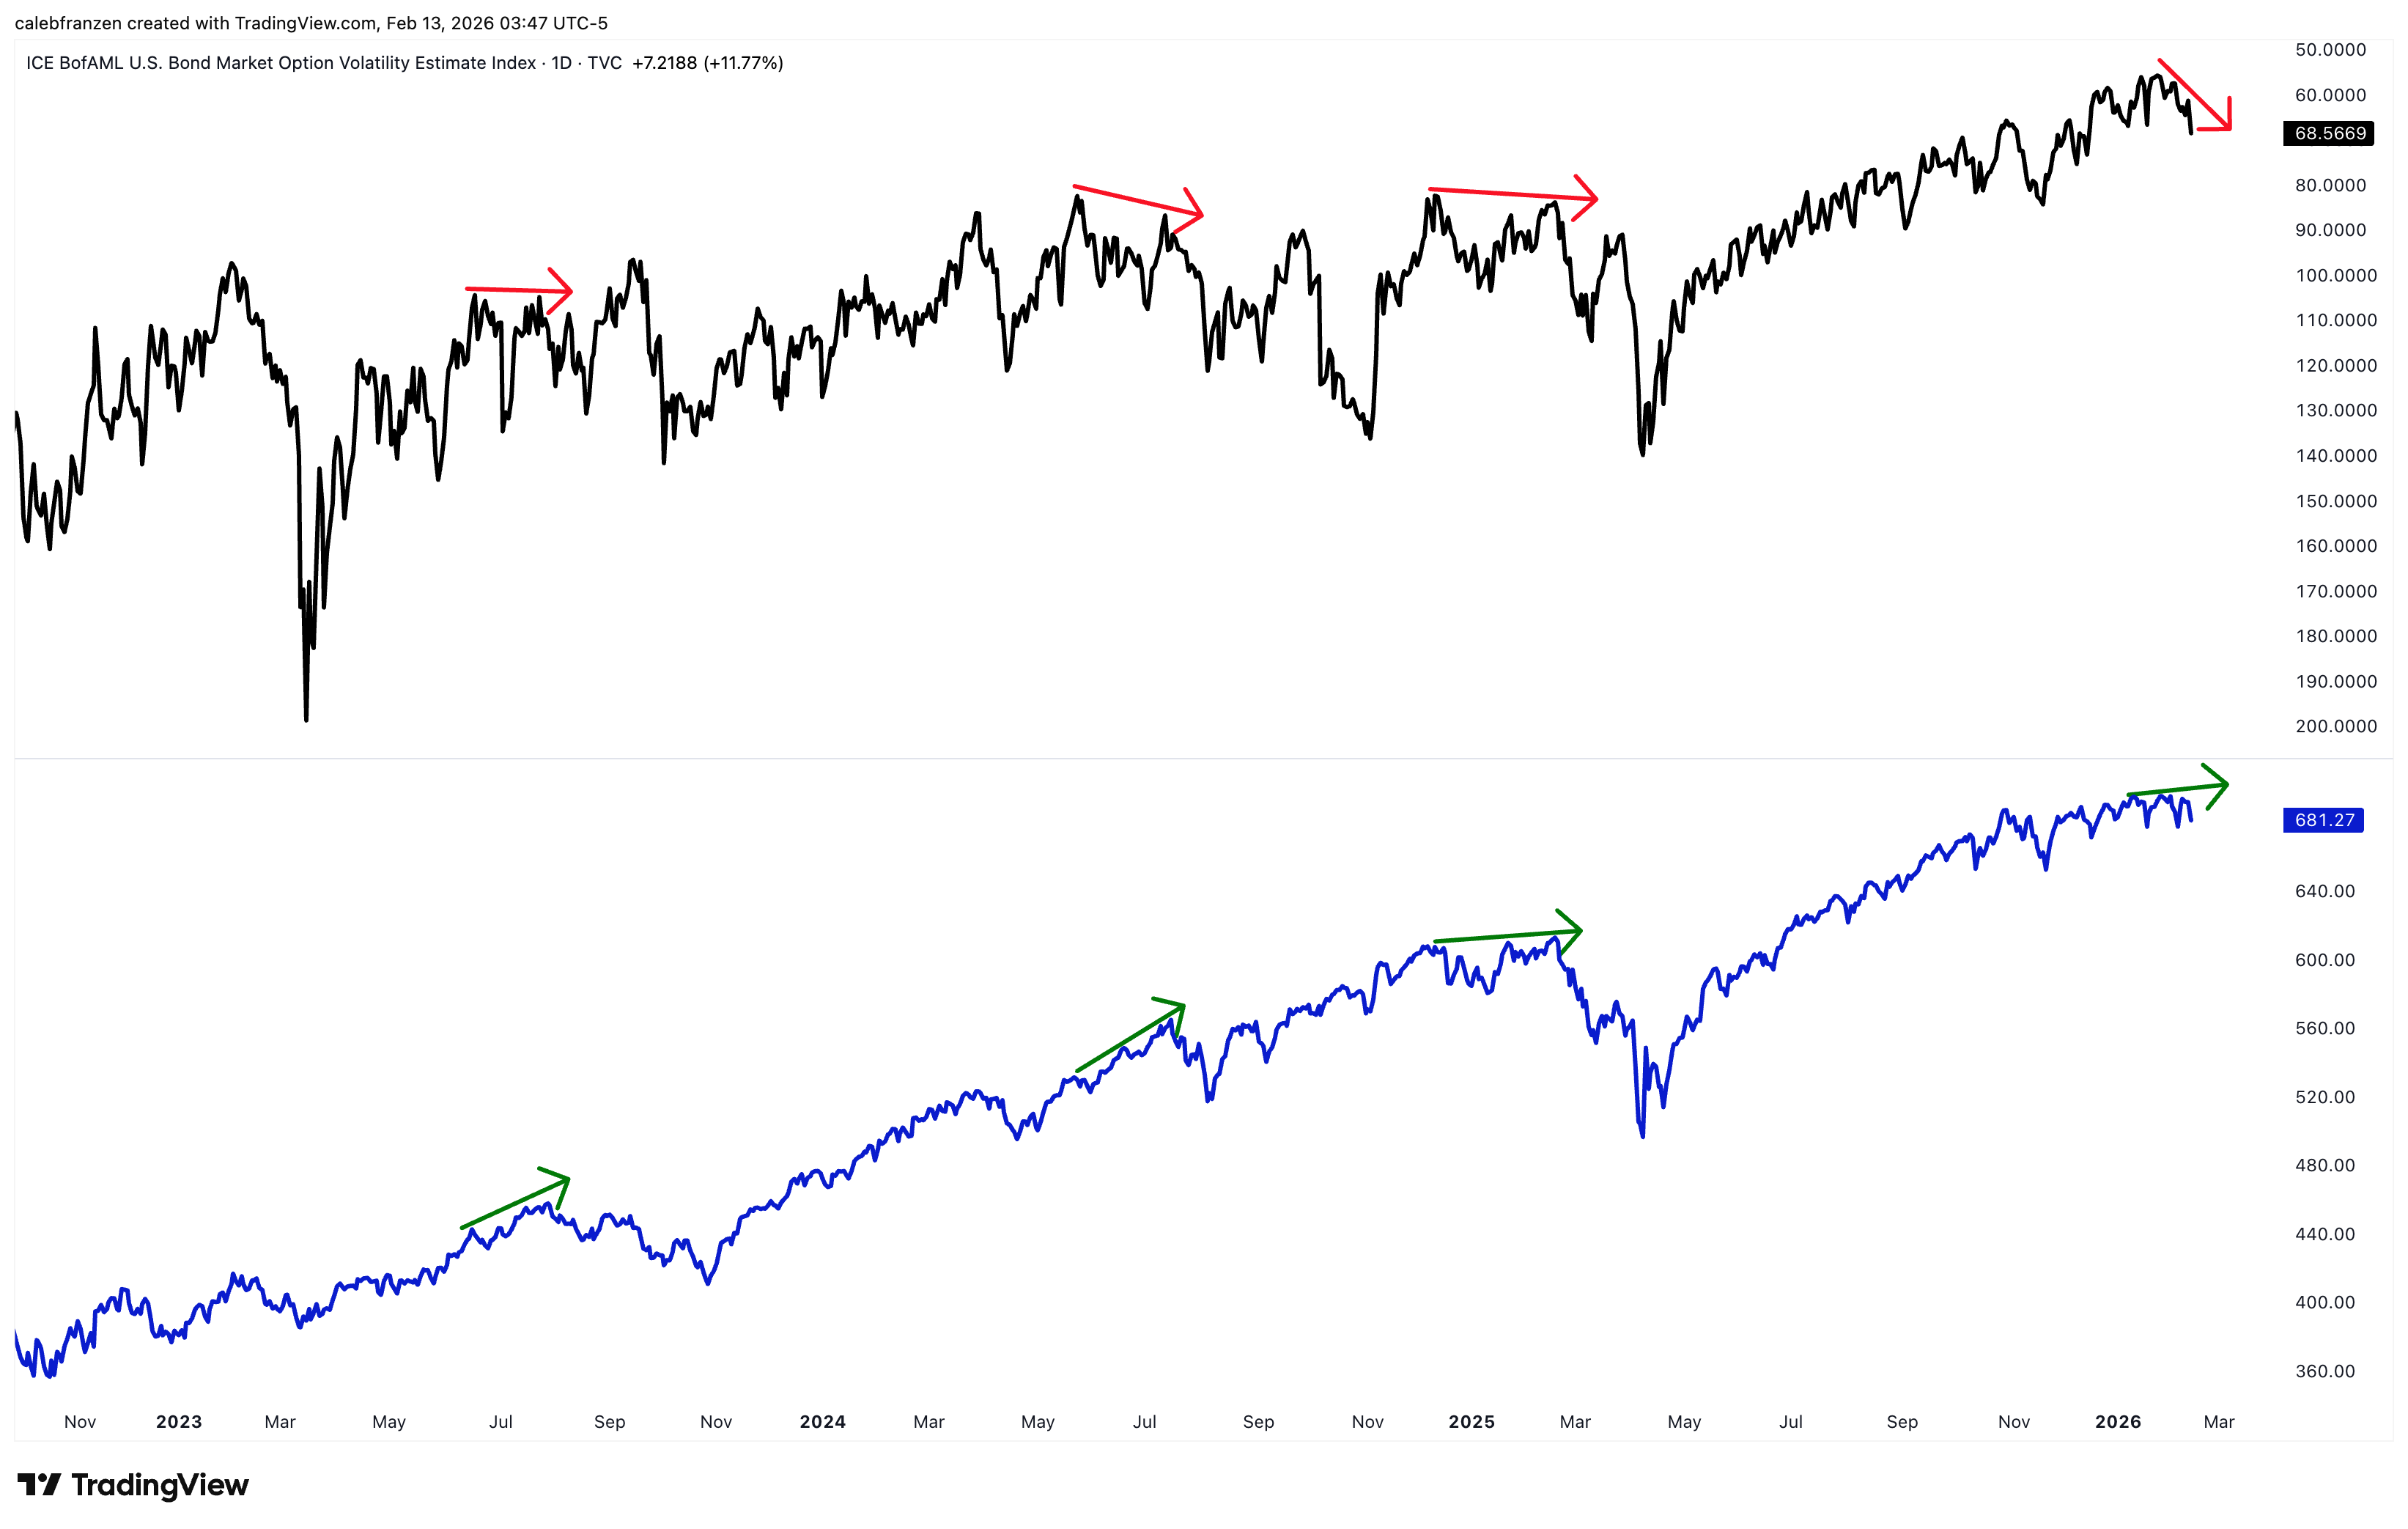
Only 3 cases over the course of the past ~3 years, with the 4th signal happening now.
The chart speaks for itself… after these divergences, equities struggled.
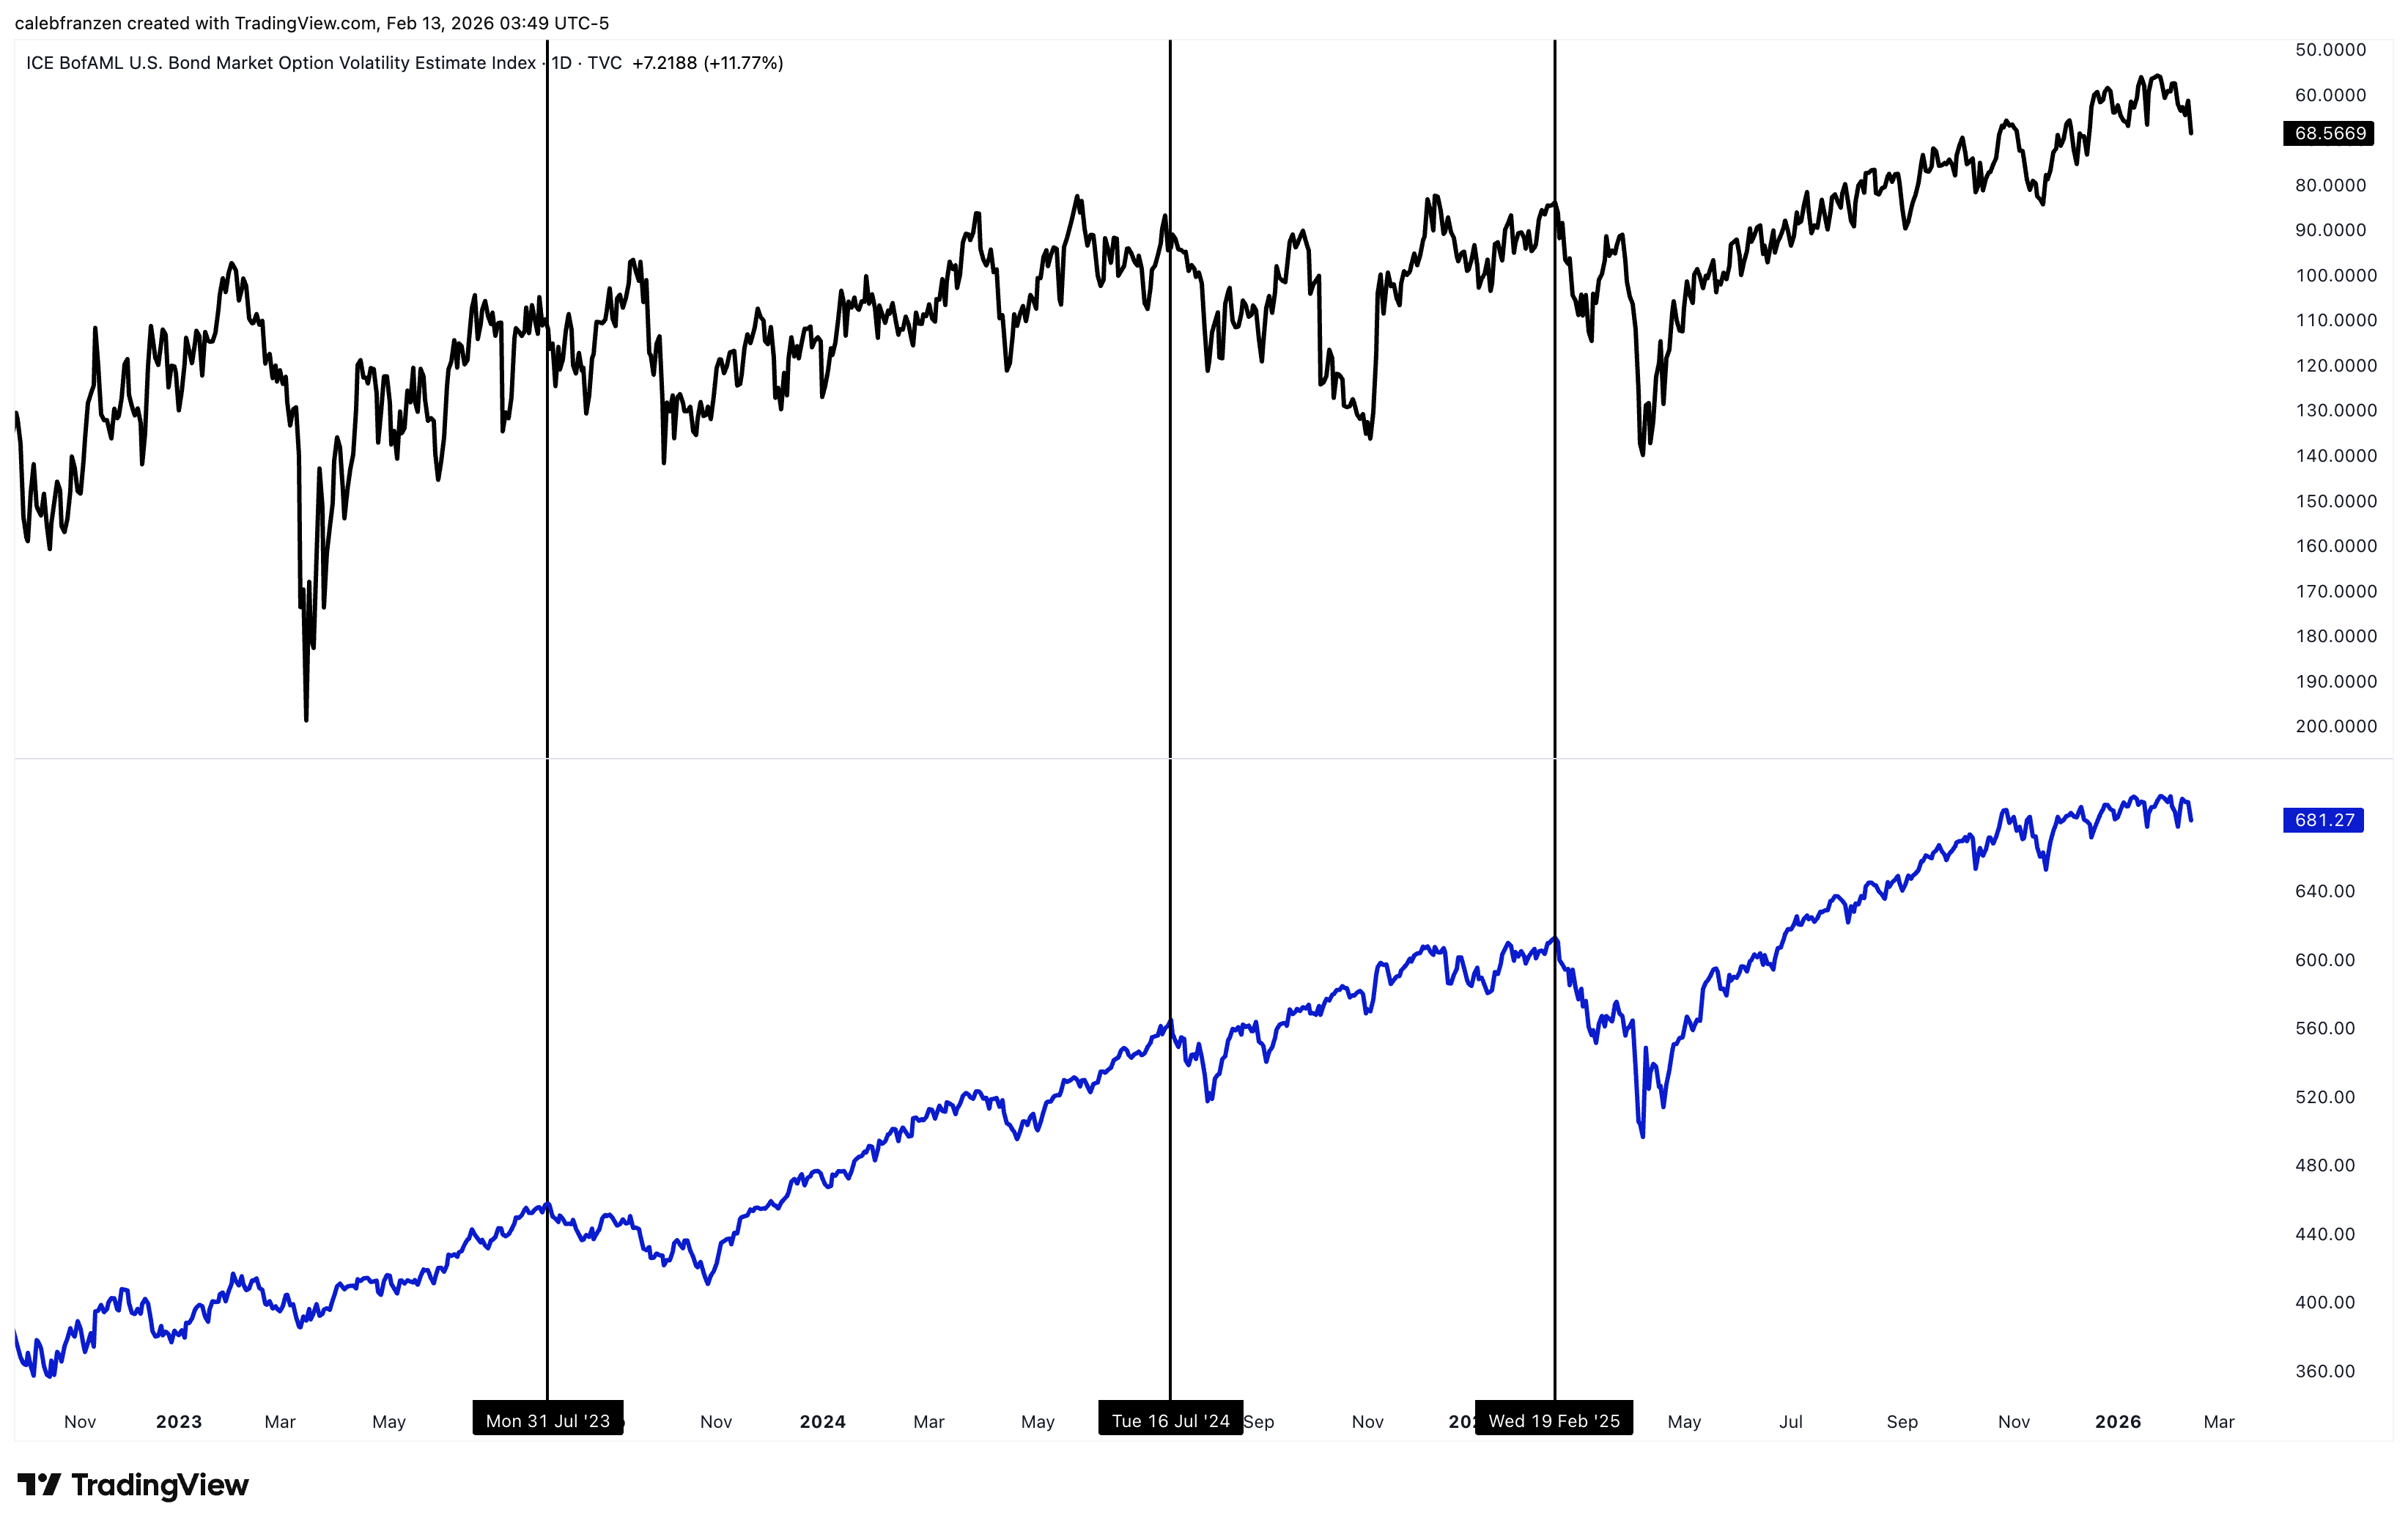
In the July 2023 case, the S&P 500 fell -10.9% over 64 trading days.
In the July 2024 case, the S&P 500 fell -9.7% in over 14 trading days.
In the February 2025 case, the S&P 500 fell -21.4% in 33 trading days.
Each of those consolidations had different justifications for happening.
Each of those consolidations had different narratives within the bull market.
And yet…
The bond market sniffed it out, irrespective of the reason.
Logically, the concern right now is that the divergence is happening again.
Will it provide the same degree of pain for the stock market as it did in the past?
I can’t tell you that with any confidence… all I know for certain is that the bond market is giving a warning to stock market investors, and I think we should listen.
Does this mean that the market is going to hell in a handbasket?
I don’t think so.
But I do think that investors should be prepared for how to handle a correction…
Think about it like this: the investors who panicked in all of those corrections after these divergences occurred probably regretted selling, due to the fact that stocks went to new all-time highs shortly thereafter.
So should we panic in the current divergence if the correction comes?
Absolutely not.
We should have a plan.
We should accept that some pain is coming.
And we should recognize that bull markets have pullbacks.
If bull markets are uptrends…
and uptrends are just the production of higher highs & higher lows…
then the market MUST have a correction in order to produce a higher low!
Given the sustained rally at the index level, the broadening participation, and the huge rotation out of tech/mega-caps/growth into industrials/energy/staples/utilities, I think this market is due for a correction and I actually welcome it with open arms!
Am I going to short the market?
No.
Did I sell more stocks this week, as I did last week and the week before?
Yes.
If I’m “wrong” and this correction of 3-10% doesn’t come and the market just rips higher from here, will I be any worse off than I am today?
No.
Could I have made more money if I didn’t sell some stocks?
Yeah, sure… but it’s all about risk & reward to me.
Right now, I don’t see the need to put my foot on the gas pedal.
If I’m wrong, then I can live with that.
If I’m right, then I get to stay calm while others panic & use that dip to my advantage.
That’s why I wanted to share this analysis with you.
To show you the chart, the relationship, the divergence, and the data.
And to let you make your own decisions based on your investing style.
Good luck and embrace nuance.
Best,
Caleb Franzen,
Founder of Cubic Analytics
This was a free edition of Cubic Analytics, a publication that I write independently and send out to 14,500+ investors every Saturday (typically). Feel free to share this post!
To support my work as an independent analyst and access even more exclusive & in-depth research on the markets, consider upgrading to a premium membership with either a monthly or annual plan using the link below:
There are currently 1,150+ investors who are on a premium plan, accessing the exclusive alpha and benefits that I share with them regarding the stock market, Bitcoin, and my own personal portfolio.
DISCLAIMER:
This report expresses the views of the author as of the date it was published, and are subject to change without notice. The author believes that the information, data, and charts contained within this report are accurate, but cannot guarantee the accuracy of such information.
The investment thesis, security analysis, risk appetite, and time frames expressed above are strictly those of the author and are not intended to be interpreted as financial advice. As such, market views covered in this publication are not to be considered investment advice and should be regarded as information only. The mention, discussion, and/or analysis of individual securities is not a solicitation or recommendation to buy, sell, or hold said security.
Each investor is responsible to conduct their own due diligence and to understand the risks associated with any information that is reviewed. The information contained herein does not constitute and shouldn’t be construed as a solicitation of advisory services. Consult a registered financial advisor and/or certified financial planner before making any investment decisions.
Each investor is responsible to understand the investment risks of the market & individual securities, which is subjective and will also vary in terms of magnitude and duration.
Great work here, Caleb. Thank you
Thanks Caleb, you're the man